Reading the Candle Beneath the Candle
What three numbers measure a candle's real strength?
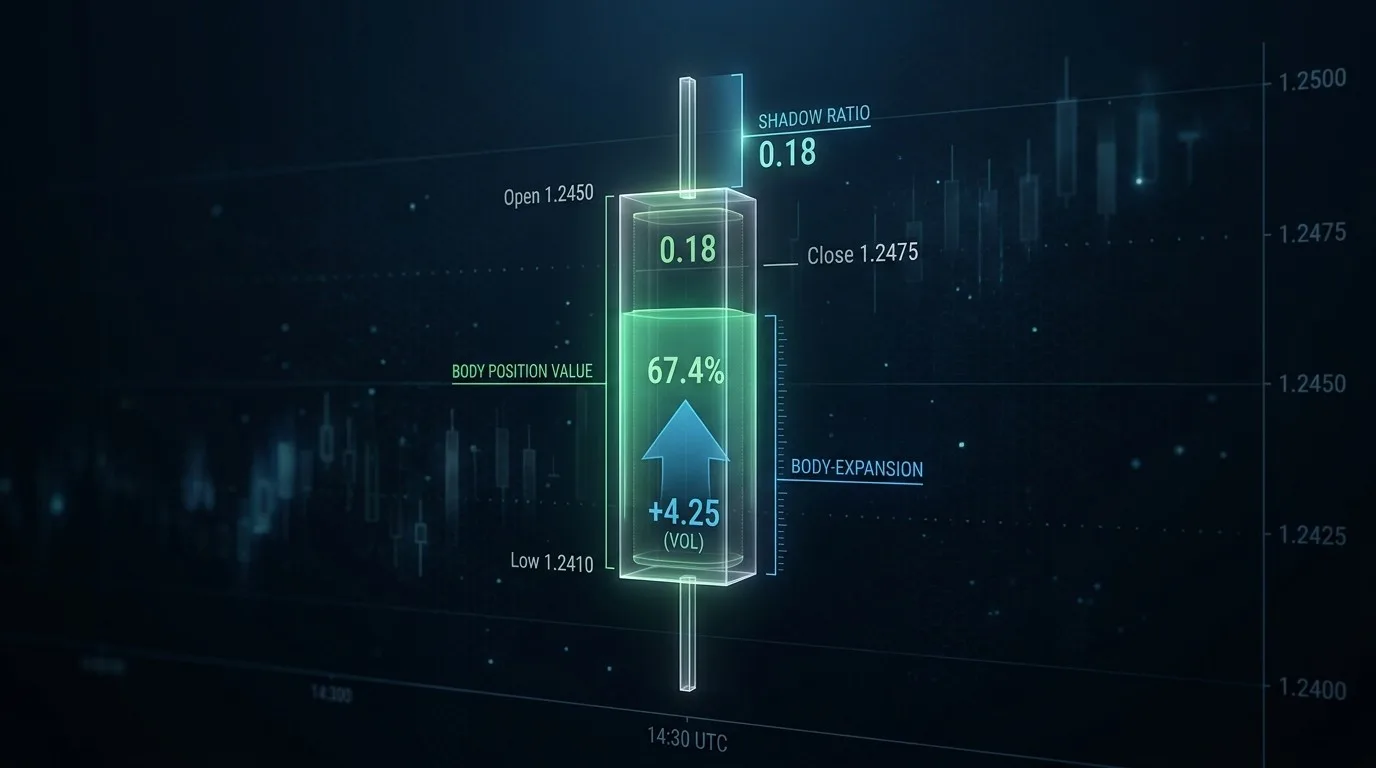
Pattern names compress a candle into a label and lose the structural information inside it. Three measurements restore what's lost: shadow ratio (wick divided by body — above 1.5 means one side tried hard and failed), body position (where the close sits in the high-low range, 0 to 1 — above 0.7 means buyers held the finish), and body expansion (successive bodies growing signals building conviction; shrinking signals fading). When all three agree, the signal carries more weight than any pattern name.
You've studied the patterns. Hammer at support, shooting star at resistance, engulfing candle confirming the reversal. You've taken the textbook trade and watched the pattern fail. The "confirmed" reversal kept going the wrong way. And then, on a completely unremarkable candle with no recognizable pattern at all, price snapped in the other direction.
The disconnect isn't random. Candlestick analysis as most traders learn it relies on visual recognition and subjective interpretation, which means two traders can look at the same candle and disagree about what it means. But inside every candle are three measurable quantities that describe the battle between buyers and sellers with far more precision than a pattern name ever could. They won't eliminate uncertainty. They'll tell you when the visual pattern is lying.
What Candlestick Analysis Misses When It Stops at Patterns
Candlestick patterns fail because they compress a candle's internal information into a single label. A "hammer" at one price level behaves differently from a hammer at another, and the classification captures none of the differences in rejection strength, closing control, or building conviction that determine whether the signal is worth acting on. Three numbers restore what the label strips away.
Research by Marshall, Young, and Rose at Massey University tested 28 candlestick patterns across 35 markets over a decade and found that none produced statistically significant profits after adjusting for transaction costs (Journal of Banking & Finance, 2006). The patterns aren't useless as observational tools, but the classification system loses the very information that makes individual candles meaningful.
Consider a hammer candle on NIFTY at 23,200. Standard analysis reads "bullish reversal signal." But how strong was the rejection? Did buyers push back with force, or did selling simply dry up? Where did price close relative to the full range — near the top of the body, or stuck in the middle? A hammer with a lower shadow 2.1 times its body and an upper-quartile close is a fundamentally different signal from one with a shadow ratio of 1.2 and a mid-range close. Both get the same pattern name. They carry very different information about who controlled that bar.
Shadow Ratio — Quantifying Rejection Strength
Shadow ratio measures how large a candle's rejection wick is relative to its body, expressed as a multiplier. When the lower shadow is 1.5 times the body, sellers pushed price down but buyers absorbed the pressure and reclaimed most of the range before the close. That's quantified rejection, not a visual guess, consistent regardless of chart zoom or timeframe.
The math is straightforward: divide the length of the relevant shadow by the body length. A ratio of 1.0 means wick and body are equal, notable but not decisive. At 1.5, the rejection starts carrying weight. At 2.0 or above, one side tried aggressively and failed.
What separates this from simply eyeballing a long wick? Consistency. Traders who read wicks visually tend to overweight dramatic-looking candles on higher timeframes while missing subtler rejections on 5-minute or 15-minute charts that carry an equivalent quantitative signal. A shadow ratio of 1.75 is 1.75 whether it appears on a daily bar or a 5-minute one.
NVDA at $180 in early March provides a clean example. Price had sold off across three sessions. The candle that marked the low didn't look like a textbook reversal, no hammer shape, no engulfing formation. But the lower shadow ratio read 1.75. Sellers pushed price down significantly within that bar, and buyers absorbed the pressure and reclaimed most of the range before the close. The number captured what the pattern name missed entirely.
The critical distinction: a high shadow ratio isn't bullish or bearish by itself. A lower shadow ratio of 1.75 says buyers absorbed selling pressure. An upper shadow ratio of 1.75 says sellers absorbed buying pressure. Direction comes from which shadow carries the reading. The magnitude tells you how decisive the rejection was.
Body Position — Reading Who Controlled the Close
Body position measures where a candle's close sits within its high-to-low range, on a zero-to-one scale. A reading above 0.7 means buyers controlled the finish despite whatever happened during the bar, while readings below 0.3 mean sellers held the close. This is more granular than the bullish-or-bearish binary most traders default to, and matters most when candle colors alternate rapidly.
A green candle that closes near the bottom of its range (body position 0.35) is a very different statement from one that closes near the top (body position 0.85). The first suggests buyers showed up but couldn't hold their ground. The second says they dominated. Both candles are green. Only one reflects genuine buyer control.
This becomes particularly useful during consolidation, where pattern recognition fails almost completely. If the last four candles show body positions of 0.42, 0.55, 0.68, and 0.78, regardless of their colors, buyers are progressively winning the close. That's directional information hiding inside what looks like a choppy, indecisive range.
SEBI's 2023 study on F&O trading found that 89% of individual derivatives traders lost money over the analysis period (SEBI, "Analysis of Profit and Loss of Individual Traders dealing in Equity F&O Segment," January 2023). Part of those losses comes from acting on surface-level signals, including pattern-based candlestick interpretation, without reading the structural information beneath them. Body position won't fix everything. It does eliminate one common misread: treating candle color as the whole story when it's barely the first word.
Body Expansion — Whether Conviction Is Building or Fading
Body expansion tracks whether successive candle bodies are growing or shrinking, measuring conviction trajectory behind a move. When bodies expand after a reversal, participants in the new direction are committing with increasing force, validating the turn. When bodies contract despite price still moving directionally, conviction is fading and the move may be running out of fuel before it's established.
This metric doesn't evaluate a single candle in isolation. It reads the sequence. After a momentum flip — say price shifts from making lower lows to making higher lows — the quality of that reversal depends on what comes next. Are the candles in the new direction getting bigger? That's expanding conviction. The turn has genuine participation building behind it. Are they getting smaller? The reversal may lack the follow-through to survive.
Research by Lo, Mamaysky, and Wang at MIT established that technical signals with volume confirmation were significantly more reliable than those without (Journal of Finance, 2000). Body expansion serves a parallel function for candle reading specifically: it separates reversals with building conviction from those that are just a brief bounce off a level.
SPY's reversal off its March lows illustrates the distinction. The first green candle after three days of selling had a body-to-range ratio of 0.45. The next: 0.58. Then 0.71. Each successive candle committed more of its range to the bullish body. That progression isn't a bounce. It's a validated momentum shift, readable from the numbers before price structure confirmed a higher high.
When All Three Numbers Point the Same Direction
When shadow ratio, body position, and body expansion agree on the same candle or sequence, the signal carries more weight than any individual metric. This confluence transforms candlestick reading from subjective interpretation into a measurable assessment of who controlled the bar and whether that control is increasing. Each metric captures a different dimension: rejection strength, closing control, and conviction trajectory.
A candle showing a lower shadow ratio of 1.8, a body position of 0.82, and an expanding body relative to the prior bar is three independent measurements agreeing that buyers dominated with increasing force. When one metric disagrees (say the shadow ratio is strong but the body is contracting), the signal is ambiguous, and treating it like a clean reversal is the kind of overconfidence that pattern-based reading encourages.
Add velocity context and the signal sharpens further. When price velocity flips from negative to positive on the same candle where shadow ratio and body position both favor buyers, the reversal is registering in both candle mechanics and swing dynamics simultaneously. The NVDA example at $180 showed exactly this: shadow ratio of 1.75, upper-range body position, and velocity shifting from -1.52 to +2.07 points per minute. The reversal was measurable in the numbers before a higher low printed on the chart.
What This Changes About How You Read Candles Before a Trade
Candle intelligence metrics convert "does this candle look like a reversal?" into three numbers you can evaluate before committing capital. Instead of debating whether a candle qualifies as a hammer or engulfing, you check shadow ratio for rejection strength, body position for closing control, and body expansion for conviction, and know whether the candle supports your thesis or contradicts it.
The shift in practice is simple. Before entering on what looks like a reversal candle, check three things. Is the shadow ratio above 1.5 on the relevant side? If sellers pushed price down but the ratio is only 1.1, the rejection is weak and the "hammer" is cosmetic rather than structural. Where's the body position? If it's below 0.5 on a candle you're reading as bullish, buyers didn't win the close. Is the body expanding relative to the prior candle? If it's contracting, the reversal may lack follow-through.
This doesn't replace your existing process. It adds a filter you can apply in seconds. You still read structure, still check the higher timeframe, still consider whether the level has a reason to hold. But when the visual pattern lines up and the candle metrics confirm it, you have three independent reasons to act beyond "it looks right." And when the metrics contradict the visual pattern, that contradiction is saving you from a trade that looked better than it was.
Draconic, an AI trading intelligence platform, surfaces these candle metrics automatically for every bar: shadow ratio, body position, body-to-range ratio, and a nine-level sentiment classification from strong bull to strong bear. Instead of squinting at the candle and assigning a subjective label, you get the numbers that describe what actually happened inside the bar.
Here's what that looks like for a RELIANCE candle on the 15-minute chart: shadow ratio at 1.68, body position at 0.78, body expanding from the prior bar. Three numbers, one view, no pattern debate. The question changes from "does this look like a reversal?" to "do the measurements support one?"
The Numbers Behind the Candle You're Watching
The candle you're staring at contains more information than its shape suggests. Pattern names compress that information into a label, losing the structural nuance that determines whether the signal is real or cosmetic. Shadow ratio, body position, and body expansion put that nuance back into numbers.
Next time a candle "should" mean something, check what those three measurements say. You might find the numbers agree with the pattern. You might find they don't. Both answers change what you do next.
More like this
July 4, 2026ai-trading
Chartink Alternative: Draconic vs Chartink
The Draconic Team • 6 min
July 4, 2026ai-trading
Sensibull Alternative: Draconic vs Sensibull
The Draconic Team • 6 min
May 12, 2026behind-the-price
Sector Rotation — The Macro Signal Most Traders Ignore
The Draconic Team • 3 min
May 11, 2026behind-the-price
How Market Makers Create Invisible Floors and Ceilings
The Draconic Team • 11 min