Confluence Isn't Agreement — It's Independent Confirmation
What is real confluence in trading?
Confluence isn't multiple indicators agreeing — it's independent signal categories confirming the same thesis. RSI, MACD, and Stochastic all derive from closing prices, so three momentum readings count as one signal, not three. Real confluence comes from five distinct dimensions: trend, momentum, flow, structure, and options positioning. Each measures something the others can't see. Three or more independent categories aligning is the minimum threshold for standard sizing. Below three, the apparent agreement is one voice echoed multiple times.
Three indicators confirmed the short. RSI at 74, MACD histogram declining, Stochastic crossed down from overbought. You sold, and price climbed another 200 points.
The indicators weren't wrong. They all measured momentum, and momentum was genuinely extended. But that's one signal, not three. RSI, MACD, and Stochastic derive from the same underlying data: recent closing prices processed through different mathematical formulas. When one reaches an extreme, the others are nearly obligated to follow. What felt like confluence in your trading process was one observation echoed three times.
This distinction costs real money. Genuine confluence requires signals from genuinely different dimensions of market data, not more indicators measuring the same thing from slightly different angles. The framework for telling the difference is simpler than most traders expect, and it changes how every setup gets evaluated.
Why Three Momentum Indicators Aren't Three Signals
Indicators built from the same underlying data produce correlated outputs, not independent confirmation. RSI, MACD, and Stochastic all calculate momentum from recent closing prices using different mathematical transformations, but the raw material is identical. When one reaches an extreme reading, the others cluster near extremes too, because they're all measuring the same underlying force from slightly different angles.
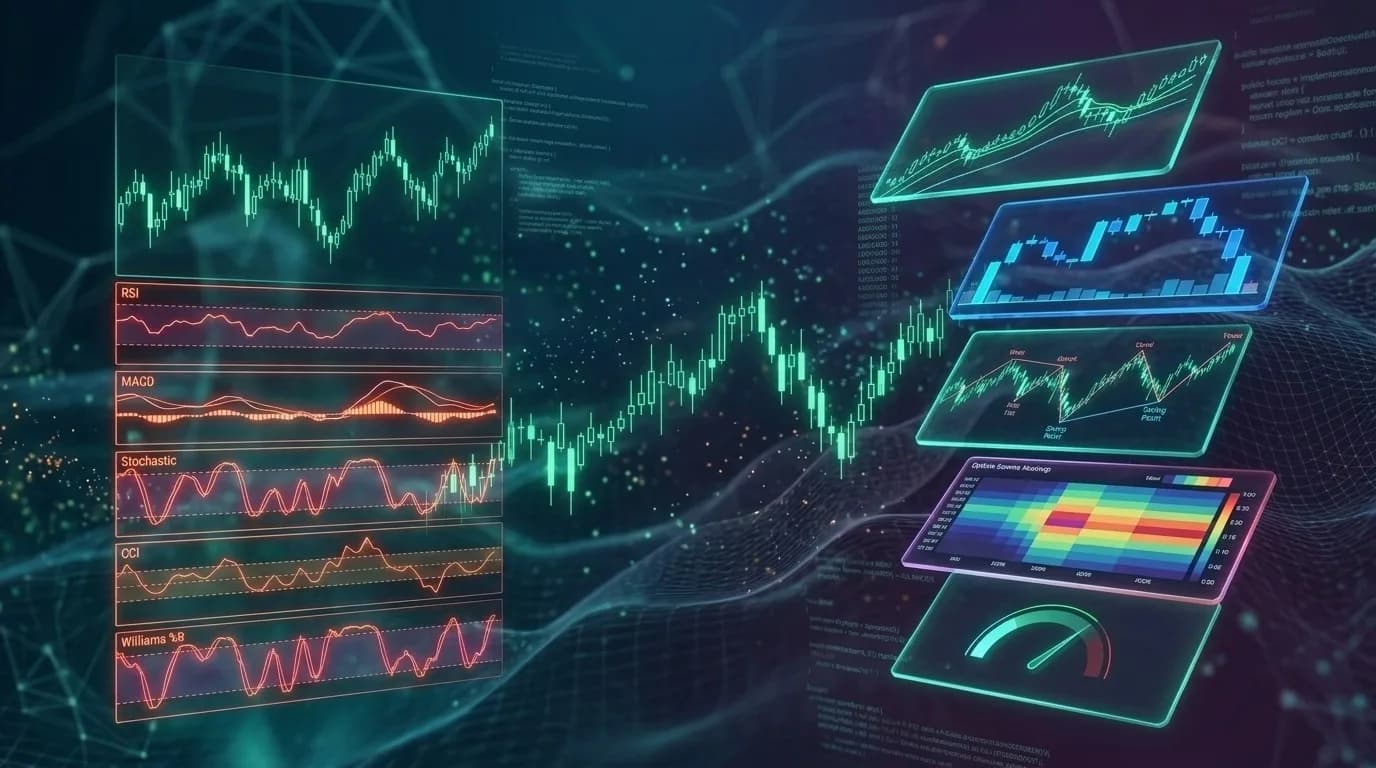
The mathematical overlap is straightforward. RSI compares the average magnitude of recent up-closes to down-closes over 14 periods. MACD calculates the difference between a 12-period and 26-period exponential moving average of closing prices. Stochastic measures where the current close sits relative to the high-low range over 14 periods. All three start with closing prices. All three operate over similar lookback windows. All three attempt to answer the same underlying question: is recent price momentum strong or weak?
Alexander Elder identified this problem in "Trading for a Living" (1993), dividing indicators into distinct groups based on what they fundamentally measure and warning traders against stacking indicators from the same family. Two oscillators used simultaneously don't add information, he argued. They add false confidence. Three decades later, most traders still haven't internalized the warning.
The problem compounds as traders pile on. CCI joins the momentum stack. Williams %R adds another reading. Each new indicator on the chart feels like another confirmation, but the correlation between oscillator readings during trending conditions is high enough that a fourth or fifth oscillator provides negligible additional information beyond what the first one already showed. Five correlated momentum readings carry barely more signal than one.
This is where most confluence trading strategies collapse. A trader builds a checklist: RSI must confirm, MACD must confirm, Stochastic must agree, moving average slope must align. Each tick mark feels like independent evidence building a case. But if three of those four conditions derive from the same underlying price momentum data, the checklist has a structural redundancy that inflates apparent conviction without adding genuine cross-validation. The trader feels confident because multiple boxes are checked. The market doesn't care how many boxes came from the same source.
Five Signal Categories That Measure Genuinely Different Things
Independent confirmation in trading means signals derived from different data sources and measuring different market dimensions. Five categories qualify: trend structure, momentum, order flow, price structure including institutional footprints, and market positioning through derivatives data. A signal from each category carries information the others can't replicate, because the underlying inputs and the questions they answer don't overlap.
Understanding why these five are independent requires examining what each one actually measures and where its data originates.
Trend measures whether directional movement is established and mature. Supertrend, Ichimoku cloud position, and moving average alignment all answer this question by analyzing the relationship between price and its recent history over medium-to-long lookback periods. When Supertrend has been bullish for 20+ bars and price sits above the Ichimoku cloud, that's a statement about directional establishment that momentum oscillators simply can't make. A trend can be firmly established while RSI sits at a neutral 55, because trend maturity and current momentum intensity are measuring different properties of the same market.
Momentum measures the rate and quality of recent price changes. This is the RSI, MACD, and Stochastic family, and it also includes velocity readings that measure swing-based rate of change contextualized against the session distribution. These indicators are genuinely valuable for what they measure. The problem isn't that they're useless. It's that traders treat three of them as three signals when one momentum reading is sufficient for scoring purposes.
Flow measures who's actually doing the buying and selling, and how aggressively. Cumulative volume delta (CVD) tracks whether trades are being initiated at the ask (aggressive buying) or at the bid (aggressive selling). On-balance volume (OBV) tracks cumulative volume direction. The accumulation/distribution line uses each candle's close position within its range to estimate institutional intent. These metrics use trade-level and volume data that momentum oscillators never touch. A stock can show rising momentum with RSI at 65 while CVD falls, meaning the price advance isn't backed by aggressive buying. That divergence between momentum and flow is invisible to anyone only looking within one category.
Research by Lo, Mamaysky, and Wang (2000), published in the Journal of Finance as "Foundations of Technical Analysis," examined the informational content of technical patterns and found that combining analytical approaches from different domains produces substantially less correlated signals than combining approaches from the same domain. The principle applies directly to indicator categories: cross-category signals carry independent information that within-category signals don't.
Structure measures the footprints of institutional activity encoded in price patterns at the swing level. Break of structure (BOS), change of character (CHOCH), fair value gaps, and order blocks are derived from swing-level price relationships that reveal where large participants entered, where imbalances remain, and whether a trend's structural integrity is intact. These patterns operate on a completely different analytical axis than oscillator-based momentum or volume-based flow. A stock can show declining momentum while its structure remains firmly bullish, with no CHOCH detected and order blocks untested. When structure and momentum disagree, the resolution of that tension often determines the next significant move.
Positioning measures what derivatives market participants expect to happen and how their hedging activity creates mechanical price effects. Open interest concentration, put/call ratios, and gamma exposure (GEX) all use options market data, an entirely separate source from price charts, volume feeds, or trade flow. Research by Ni, Pearson, and Poteshman (2005), published in the Journal of Financial Economics, found that options positioning creates measurable clustering effects on stock prices near expiration, demonstrating that derivatives data carries directional information independent of anything visible on a standard price chart. When options positioning shows heavy put buildup and negative gamma while price momentum reads bullish, the derivatives market is pricing a different scenario than the spot chart suggests.
Scoring Confluence by Category, Not by Count
A confluence score based on independent categories counts how many of the five signal dimensions agree on direction, not how many individual indicators flash the same color. Three or more categories aligning represents genuine multi-dimensional confirmation. Two or fewer means the setup lacks cross-validation that separates high-probability entries from setups that only appear confirmed because redundant signals inflated the count.
The thresholds are deliberately simple. Before entering any trade, count how many of the five categories support the thesis. Each category contributes one point, regardless of how many indicators within that category agree. RSI, MACD, and Stochastic all bearish? That's one point for momentum. Not three.
Three categories aligned is the minimum threshold for a standard-sized position. Four is strong enough to size with conviction. Five is rare, and when every dimension agrees, the probability profile is as favorable as multi-factor analysis can make it. Below three, the setup either isn't ready or it warrants significantly reduced size. The number six on a checklist means nothing if three of those six come from the same category.
Here's what this framework reveals when applied to real instruments.
False confluence on NIFTY at 23,600, Thursday afternoon. A trader sees RSI at 72, MACD histogram declining, and Stochastic crossing down from overbought. Three bearish indicators. The trader counts three confirmations and shorts. But the category score is one. All three signals measure momentum.
Checking the remaining categories exposes the problem. Trend: Supertrend has been bullish for 30+ bars, price is above the Ichimoku cloud, and 15-minute moving averages are aligned upward. Flow: CVD is rising, with aggressive buying at the ask dominating the session. Structure: no CHOCH detected, no bearish order blocks nearby, and the most recent swing maintained a higher low. Positioning: heavy put OI concentration at 23,400 forms a floor, with positive gamma compressing volatility toward the mean.
Four categories are bullish. One category shows an extended reading that is, in context, the normal oscillation of a strong uptrend. The momentum reading was accurate as a momentum reading. But it wasn't a reversal signal. It was one category, measured three different ways, disagreeing with four others. The short gets stopped out as price continues the established trend.
SEBI's January 2023 study, "Analysis of Profit and Loss of Individual Traders dealing in Equity F&O Segment," found that 89% of individual F&O traders incurred net losses during the study period. The causes are complex, but the structural pattern of treating correlated indicator stacking as conviction contributes to systematic underperformance. Traders don't lack information. They lack independent information.
Real confluence on SPY at $528, pullback to a 5-minute demand zone. Trend: Supertrend bullish on the 15-minute, price above the hourly Ichimoku cloud. Momentum: RSI pulling back to 45 on the 5-minute, moderate and non-extreme, with room to expand. Flow: CVD holding positive during the pullback, meaning aggressive sellers aren't pressing. Structure: the pullback has landed precisely on an untested bullish order block from the morning session, and no CHOCH has occurred. Positioning: call open interest dominates the nearest strikes, positive gamma regime, put wall sitting 15 points below current price.
Category score: five. Every independent dimension confirms the bullish thesis. This doesn't guarantee the trade works, because every individual trade exists within a probabilistic distribution where losses are inevitable regardless of signal quality. But the probability profile is fundamentally different from a setup where five indicators from two categories created the illusion of broad agreement.
The BTC consideration. Cryptocurrency markets lack centralized options data for most trading pairs, and order book classification for CVD is unreliable on decentralized exchanges. This means the positioning category and portions of the flow category may be unavailable or untrustworthy. A BTC confluence assessment often operates across three or four categories rather than five. Recognizing which categories carry valid data for a given instrument prevents the framework from generating false confidence by scoring dimensions where the information doesn't exist or can't be trusted. A three-out-of-three score on available categories is genuine. A five-out-of-five that includes two fabricated dimensions is worse than no framework at all.
What Changes When You Score by Independence
Applying the independent confluence framework means checking each of the five signal categories before entry, counting how many support the thesis, and sizing the position accordingly. The practical shift is from asking "how many indicators agree?" to asking "how many independent dimensions of market data confirm what I'm seeing?" That single question changes the quality of every trade decision.
The workflow has three steps, and it takes less time than scanning a wall of correlated oscillators because you're evaluating five distinct dimensions instead of twenty redundant readings.
First, classify each signal on your screen by its category. If RSI, MACD, and Stochastic are all present, that's one momentum input for scoring purposes. Pick the one you find most informative and treat the others as visual context, not additional confirmation. Reducing chart clutter doesn't lose information when the information was redundant to begin with.
Second, check at least one signal from every category available for your instrument. For equity and index traders, all five categories are typically accessible. For crypto traders, positioning may be limited or absent. For forex, flow data can be unreliable depending on the data source. Know which categories carry valid data for what you trade, and adjust your maximum possible score accordingly.
Third, set a minimum threshold and hold to it. Three independent categories confirming is the baseline for a standard position. Below three, either the setup isn't ready or you reduce size substantially. At four or five, conviction supports fuller sizing because the cross-validation is genuine, not an artifact of correlated readings.
Running through five categories manually requires multiple screens, multiple apps, and minutes of cognitive effort under time pressure. Draconic, an AI trading intelligence platform, synthesizes across all five categories simultaneously, surfacing where dimensions agree and where they conflict in a single response. The synthesis converts what would be a fragmented, multi-tool exercise into a question and an answer.
Each dimension contributes its own reading, and the synthesis makes category-level agreement visible without the trader needing to mentally separate correlated from independent signals. The same query works across any instrument Draconic covers, adjusting automatically for which categories carry valid data and which don't.
The setup that stopped you out probably looked confirmed. Multiple indicators agreed, the chart was clean, and the case felt solid. But if those indicators all measured the same thing, the agreement was an illusion: one voice echoed three times, not three voices reaching the same conclusion from different vantage points.
Genuine confluence doesn't require more indicators. It requires different ones.
More like this

July 4, 2026ai-trading
Chartink Alternative: Draconic vs Chartink
The Draconic Team • 6 min

July 4, 2026ai-trading
Sensibull Alternative: Draconic vs Sensibull
The Draconic Team • 6 min
May 12, 2026behind-the-price
Sector Rotation — The Macro Signal Most Traders Ignore
The Draconic Team • 3 min
May 11, 2026behind-the-price
How Market Makers Create Invisible Floors and Ceilings
The Draconic Team • 11 min