How Market Makers Create Invisible Floors and Ceilings
What is gamma exposure?
Gamma exposure (GEX) is the dollar amount options market makers must buy or sell to stay hedged for every 1-point price move. Positive GEX dampens volatility — market makers buy dips and sell rallies. Negative GEX amplifies whatever direction the market's already moving. The price where one regime flips creates mechanical support and resistance that doesn't appear on any standard chart, on any instrument with active options — NIFTY, BankNifty, SPY, SPX.
You're watching NIFTY approach 23,200 on a Thursday afternoon. There's no support line at that level. No moving average, no pivot point, no volume node, no trendline you've drawn. But price touches 23,200, bounces 40 points, touches it again, bounces again. Like there's a floor made of glass.
Across the Atlantic, an SPY trader sees the same thing at $528. Nothing on the chart explains why price keeps holding that number. The levels aren't random. They're mechanical, created by options market makers whose hedging activity generates what traders call gamma exposure.
GEX, the aggregate measure of that hedging behavior mapped to specific price levels, creates support and resistance that doesn't appear on any standard chart. Understanding it changes how you read every session in instruments with active options markets. And it operates continuously, not just near expiry. The magnetic levels that pull price toward certain strikes before expiry, discussed in the context of open interest concentration and max pain, are the static version of this force. GEX is the dynamic version, updating with every options contract traded.
Why Do Market Makers Move the Market When They're Supposed to Be Neutral?
Options market makers create price impact through continuous delta hedging, not directional bets. When a trader buys a call option, the market maker who sells it becomes short delta and must buy the underlying to neutralize exposure. As price moves, delta changes, forcing continuous adjustment. This rebalancing, multiplied across thousands of outstanding contracts, produces a measurable mechanical effect on price.
The counterintuitive part is that market makers aren't taking directional positions. They profit from the spread between bid and ask on options, not from predicting where the stock or index will go. But the hedging required to stay neutral forces them to trade the underlying in predictable patterns.
Here's the chain in plain terms. A trader buys 100 lots of NIFTY 23,500 calls. The market maker who fills that order is now short those calls. To neutralize the directional risk, the market maker buys NIFTY futures. If NIFTY rises, the calls gain delta, so the market maker must buy more futures to stay hedged. If NIFTY falls, the calls lose delta, and the market maker sells some of those futures back.
This adjustment isn't optional. It's mechanical risk management that happens continuously, across every expiry, at every strike, for every options position the market maker holds.
The academic evidence for this feedback mechanism is well-established. Avellaneda and Lipkin demonstrated in their 2003 paper "A Market-Induced Mechanism for Stock Pinning" (published in Quantitative Finance) that delta hedging by market makers creates a measurable gravitational effect where underlying prices converge toward strikes with concentrated options activity. Ni, Pearson, and Poteshman extended this finding in their 2005 paper "Stock Price Clustering on Option Expiration Dates" (Journal of Financial Economics), showing that stock prices systematically cluster near actively traded option strikes at expiration because of the hedging demand generated by those positions.
What matters for the trader watching that NIFTY 23,200 bounce is this: the hedging isn't a one-time event. It repeats with every tick of price movement. That repetition is what creates the mechanical support and resistance you felt but couldn't explain. The market maker isn't defending 23,200 because they believe in the level. They're defending it because their options book requires them to buy futures every time price drops there.
What Is Gamma Exposure and Why Does It Change Market Behavior?
Gamma exposure (GEX) is the aggregate net gamma across all options positions at every strike, revealing whether market maker hedging will dampen or amplify the next price move. Positive GEX means hedging stabilizes price. Negative GEX means hedging amplifies moves. The boundary between these regimes, the gamma flip level, is the most important options-derived price level for intraday traders.
To understand why, you need one concept: gamma measures how much delta changes per unit of price movement. High gamma at a given strike means the market maker's hedge needs frequent, significant adjustment whenever price approaches that level. Low gamma means adjustments are small and infrequent.
Positive Gamma: The Stabilizer
When aggregate GEX is positive, market makers are long gamma. Their hedge adjustments work against price movement. If NIFTY drops, their positions require them to buy NIFTY futures. If NIFTY rises, they need to sell. Buy the dips, sell the rallies. This creates natural mean-reversion pressure that compresses the session's range.
The practical effect is visible even if you've never heard the term GEX. Ranges tighten. Volatility compresses. Price tends to oscillate within a band rather than trend cleanly. If you've ever traded a session where NIFTY seemed stuck in a 50-point range for hours despite multiple attempts to break in either direction, positive gamma was likely contributing. The market makers were mechanically absorbing every push because their hedge required them to.
Negative Gamma: The Amplifier
When aggregate GEX turns negative, the dynamic reverses entirely. Market makers are short gamma. Their hedge adjustments move with price, not against it. If NIFTY drops, they must sell futures to stay hedged. If NIFTY rallies, they must buy. Sell into declines, buy into rallies. This amplifies whatever direction the market is already moving.
Negative gamma sessions look and feel different from the compressed ranges of positive gamma. Ranges expand. Moves accelerate. A 30-point drop in NIFTY triggers hedging that pushes price another 20 points lower, which triggers more hedging, which pushes price lower still. This is the feedback loop that Barbon and Buraschi documented in their 2023 paper "Gamma Fragility" (published in the Journal of Financial Economics), showing how concentrated options positioning can amplify intraday price swings beyond what the underlying order flow alone would produce.
The Gamma Flip Level
The flip level is the price where GEX transitions from positive to negative (or vice versa). Above the flip level, market maker hedging stabilizes. Below it, hedging amplifies. This single level explains why the same instrument can trade like two completely different markets within the same session.
Consider NIFTY trading at 23,300 with a gamma flip level at 23,250. Above 23,250, every dip gets bought mechanically. The market feels calm and range-bound. If price breaks below 23,250, every dip gets sold. The market suddenly feels volatile and directional. The news didn't change. The fundamentals didn't change. The hedging regime changed.
For SPY, the same mechanic operates with often narrower precision because of the depth of the US options market. A gamma flip level at $527.50 means that price behavior above that number is structurally different from price behavior below it. Traders using the same strategy on both sides of the flip level are effectively trading in two different market environments without knowing it.
Where Are the Invisible Floors and Ceilings?
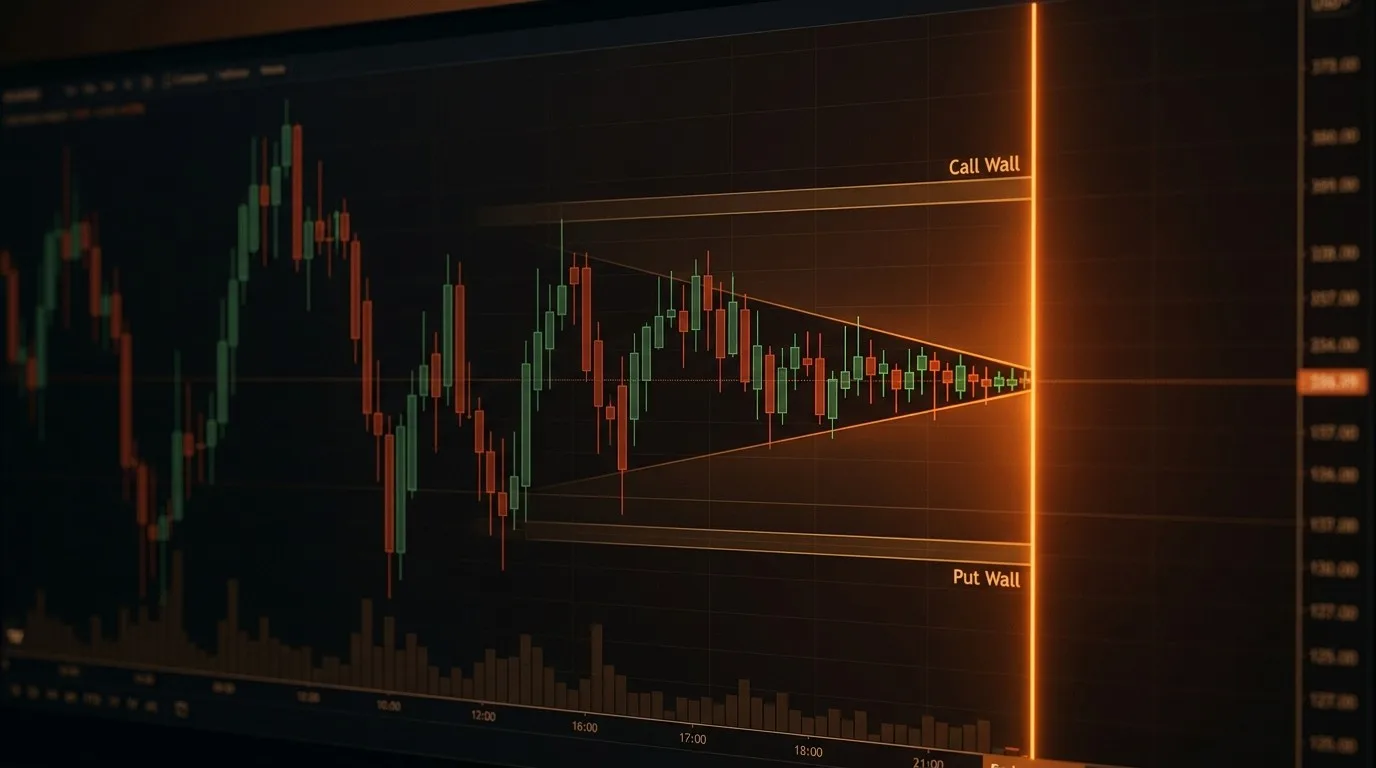
The put wall and call wall are strikes where the highest concentration of put and call open interest sits, creating mechanical support and resistance through market maker hedging. The put wall acts as a floor because hedging large put positions requires buying the underlying as price approaches. The call wall acts as a ceiling because hedging call positions requires selling.
The Put Wall as Floor
The put wall is the strike with the largest aggregate put open interest. When price drops toward the put wall, market makers who sold those puts see their delta exposure increase. To stay hedged, they buy the underlying. The more open interest concentrated at that strike, the more buying pressure the hedging generates.
On a typical NIFTY weekly expiry, the put wall might sit at 23,000 while the index trades at 23,300. As price drifts toward 23,000, the hedging-driven buying activity intensifies with each tick lower. Price doesn't just slow down. It bounces.
This is the floor you felt but couldn't see on a standard chart. No trendline created it. No historical level explained it. The options positioning did.
The Call Wall as Ceiling
The same logic works in reverse. The call wall is the strike with the largest aggregate call open interest. As price rises toward that strike, market makers who are short those calls must sell the underlying to hedge their increasing delta exposure. The concentrated selling pressure creates mechanical resistance.
If NIFTY's call wall sits at 23,500, rallies toward that level face increasingly heavy hedging-driven selling. The resistance isn't drawn from price history. It's manufactured in real time by the structure of the options market.
The Tradeable Range
Between the put wall and call wall, you have a mechanically defined range. Price is being pulled toward the center (near max pain or the point of highest gamma concentration) and repelled from the edges. This creates a predictable zone of oscillation, particularly strong in the final two sessions before expiry when gamma effects peak because of the accelerating rate of delta change as time to expiration shrinks.
For SPX options, the same structure applies. A put wall at 5,250 and a call wall at 5,350 creates a 100-point range within which market maker hedging mechanically contains price. Breaks beyond these boundaries do happen, but they require enough directional force to overwhelm the hedging flow.
How Does GEX Change What You Do Before a Trade?
Knowing the gamma regime and hedging-derived levels changes three practical decisions: whether to expect range or trend, where mechanical support and resistance sit, and how to size given the volatility environment. GEX adds an independent signal category from a completely different data source than technical indicators, price patterns, or order flow.
Step 1: Identify the Gamma Regime
Before the session starts, check whether aggregate GEX is positive or negative. In positive gamma, favor mean-reversion strategies. Breakouts face continuous selling from market makers every time price pushes into new territory, so the odds are against sustained directional moves. In negative gamma, favor momentum strategies. Fading a move in a negative gamma environment means leaning against an amplification machine where the hedging flow reinforces the direction you're betting against.
Step 2: Locate the Key Levels
Map the put wall, call wall, and gamma flip level. These aren't suggestions or educated guesses. They're mechanical boundaries created by the hedging obligations of the largest participants in the options market. Price can absolutely break through them, but the hedging flow creates friction that makes a break costly and a bounce probable.
The SEBI study published in January 2023, "Analysis of Profit and Loss of Individual Traders dealing in Equity F&O Segment," documented that 89% of individual F&O traders in India lost money over a three-year period. One structural contributor to these losses is that retail traders set support and resistance using chart-derived levels alone, without accounting for the options-derived levels that institutional hedging creates and defends. The levels retail traders see aren't the only levels that matter.
Step 3: Adjust Expectations and Size
In positive gamma sessions, expect compressed ranges. Set tighter profit targets and lean toward mean-reversion setups. In negative gamma sessions, expect expanded ranges. Use wider stops and position for continuation rather than reversal.
This is where GEX connects to the broader decision framework. Confluence across independent signal categories, where trend, momentum, flow, structure, and positioning all align, produces higher-conviction setups. GEX regime sits in the positioning category. If you're long on a technical setup but GEX is heavily negative and price is below the flip level, the positioning layer is working against you. That conflict deserves attention before you commit capital.
Seeing the Full GEX Landscape
Checking the gamma regime, locating the flip level, identifying the put wall and call wall, and assessing where price sits relative to each transition requires pulling together options chain data, open interest concentrations, and gamma calculations across every active strike. Doing that manually takes time and is prone to error, especially for traders watching multiple instruments.
This is where synthesis changes the equation. Draconic, an AI trading intelligence platform, synthesizes options positioning data alongside price dynamics, order flow, and technical signals in a single view. Instead of building the GEX map yourself from raw open interest tables, you ask a question and get the complete picture.
The output shows the gamma regime, the flip level, the put wall and call wall, and where price currently sits relative to each. That's the complete options-derived map surfaced in seconds rather than reconstructed from scattered data across multiple tabs.
Before committing to any trade in an instrument with an active options market, checking the GEX landscape is the fastest way to understand whether the session's structure favors your thesis or works against it. That 10-second check before entry is the habit that separates traders who account for the full picture from those who trade on chart levels alone.
Frequently Asked Questions About Gamma Exposure
The most common questions about GEX center on where it applies, how it differs from related concepts like max pain, and whether it functions as a directional signal. These answers address the practical boundaries of what GEX can and cannot tell a trader.
Does GEX work for all instruments?
GEX requires a liquid, centralized options market with significant open interest. It works reliably for NIFTY, BANKNIFTY, SPY, SPX, and other heavily traded options instruments. It does not apply to most cryptocurrencies, forex pairs, or commodities where options markets are thin or nonexistent. The signal is only as strong as the options activity behind it.
Can price break through the put wall or call wall?
Yes. GEX levels create friction, not absolute barriers. A strong catalyst, a shift in institutional positioning, or a sudden change in directional flow can push price through any hedging-derived level. The put wall and call wall represent where mechanical resistance is strongest, not where price cannot go.
How often does the gamma flip level change?
The flip level shifts as options positions are opened and closed throughout the session. It can move intraday as new contracts trade, but the most significant shifts happen around expiry rollovers when large positions expire and new ones are established. Checking the flip level at the start of each session and again after significant options volume is practical for most traders.
Is GEX the same as max pain?
No. Max pain is the price at which the most options contracts expire worthless, a static calculation based on total open interest. GEX measures the dynamic hedging impact of that open interest on the market maker's book. Max pain tells you where the market might gravitate by expiry. GEX tells you how hedging will affect price movement right now.
Does GEX predict market direction?
GEX does not predict direction. It describes the current hedging environment. Positive GEX predicts compressed volatility, not which way price will move. Negative GEX predicts expanded volatility, not whether the expansion will be up or down. It's a regime indicator, not a directional signal. Knowing the regime changes your strategy selection and position sizing, not your directional bias.
The Levels That Aren't on Your Chart
The invisible floors and ceilings that GEX reveals have been there for every session you've ever traded in an options-active instrument. Every time NIFTY bounced at a level with no visible support, every time SPY rejected at a price with no overhead resistance on the chart, there was a mechanical explanation hiding in the options market's structure.
You don't need to calculate gamma exposure yourself. But you need to know it exists, because the participants on the other side of your trades already account for it with every hedge they place.
More like this
May 12, 2026behind-the-price
Sector Rotation — The Macro Signal Most Traders Ignore
The Draconic Team • 3 min
May 8, 2026behind-the-price
The Magnetic Levels — Why Price Gets Drawn to Certain Numbers Near Expiry
The Draconic Team • 8 min
May 7, 2026behind-the-price
When Three Flow Signals Agree Against Price
The Draconic Team • 4 min
May 6, 2026reading-the-trade
Position Sizing Strategy: A Conviction-Based Framework for Day Traders
The Draconic Team • 11 min