When Signals Conflict — A Framework for Disagreement
What do you do when trading signals disagree?
Conflicting signals are a hierarchy problem, not a data problem. Apply context-dependent priority: in trending markets, momentum and trend structure lead. Near a key level, flow and options positioning override momentum. At a potential reversal, structural breaks (CHOCH) and exhaustion signals come first. When fewer than three independent categories support a trade, the disciplined output is "no trade." Overtrading ambiguous conditions is a significant contributor to the 89% retail F&O loss rate SEBI documented.
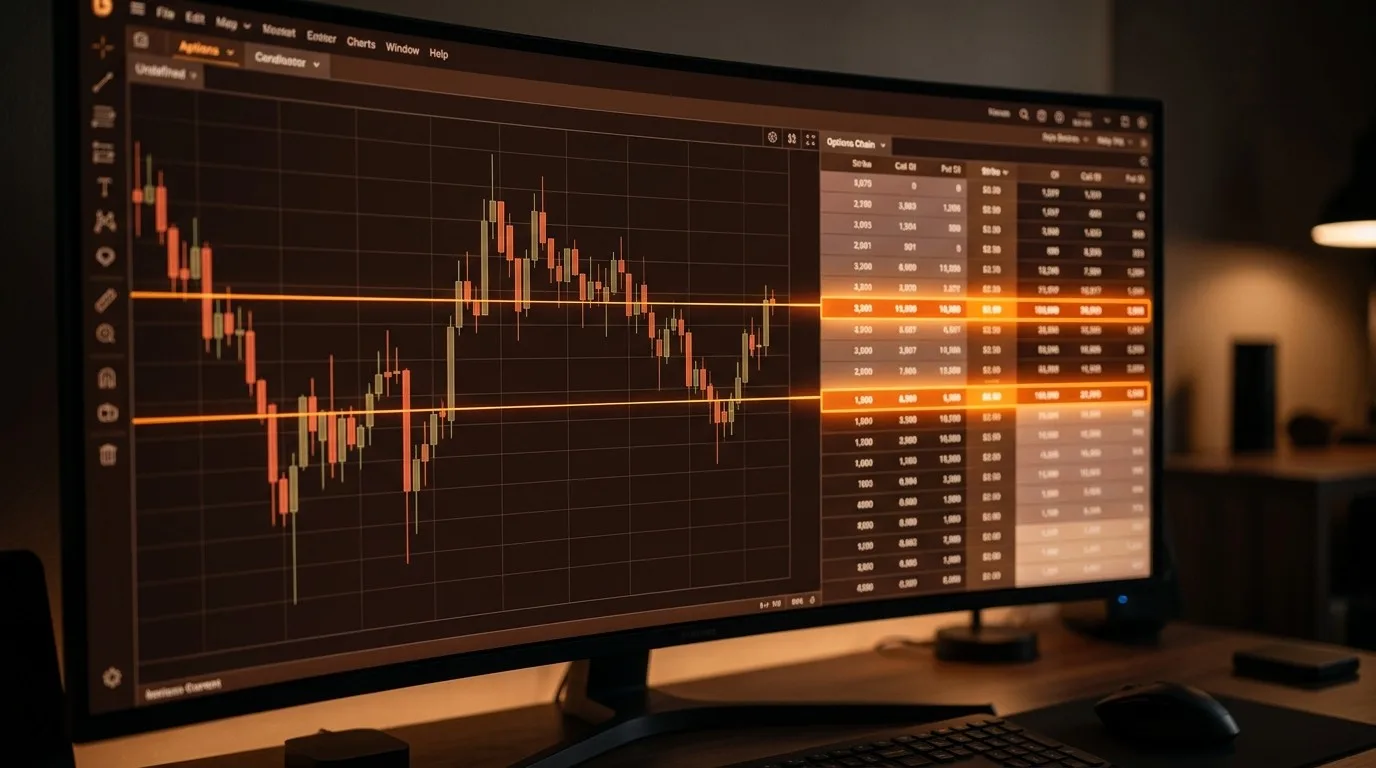
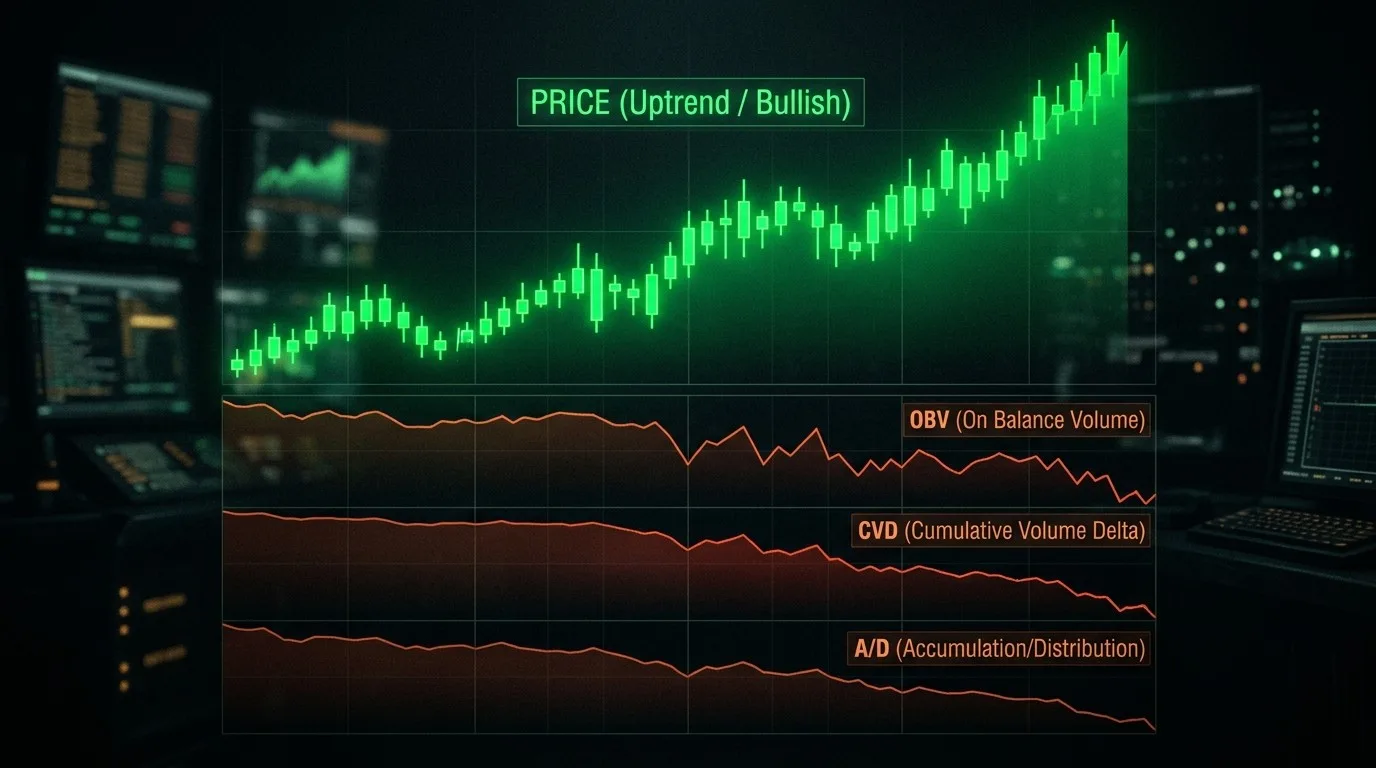
You're looking at SPY on the 15-minute chart. Trend structure is bullish. Price is above the Ichimoku cloud, above VWAP, making higher lows. Every trend indicator you check points up.
But CVD has been declining for the last hour. OBV is flat. And the options chain shows put open interest building aggressively at the nearest support strike.
The chart says buy. The flow says wait. The options market says something else entirely. You're staring at conflicting trading signals across three different data dimensions, and you don't have a system for deciding which one matters.
This is the moment where most traders either pretend the conflict doesn't exist and take the trade anyway, or stare at the screen until the setup disappears. Neither response is useful. Both cost money.
There's a better approach, and it starts with understanding that not all signals deserve equal weight.
Why Conflicting Signals Paralyze Traders
Conflicting trading signals cause losses not because traders see the wrong data, but because they lack a hierarchy for deciding which data dimension matters most in the current context. Without that hierarchy, the default response is either suppression (ignoring the inconvenient signal) or paralysis (waiting for the conflict to resolve on its own). Both patterns erode edge over time.
The problem is structural, not personal. Traders learn each indicator or data source independently. RSI does this. CVD does that. Ichimoku cloud shows this. But nobody teaches what happens when they disagree, because most trading education treats each tool as if it operates in isolation.
Research on decision-making under uncertainty explains why conflict is so disabling. Daniel Kahneman's work on cognitive load shows that when the brain faces contradictory inputs without a framework for weighting them, it defaults to one of two shortcuts: suppress the conflicting information and proceed with the dominant narrative, or delay the decision until more clarity arrives (Kahneman, Thinking, Fast and Slow, 2011). In trading, suppression leads to unhedged risk. Delay leads to missed entries and chasing.
Andrew Lo and Dmitry Repin measured the physiological responses of traders processing real-time market data and found that contradictory information produces measurably higher stress, which correlates with poorer decision quality (Lo & Repin, "The Psychophysiology of Real-Time Financial Risk Processing," Journal of Cognitive Neuroscience, 2002). The body responds to the conflict before the mind resolves it.
The fix isn't more data. It's a framework for deciding which data takes priority, and that framework depends on what the market is doing right now.
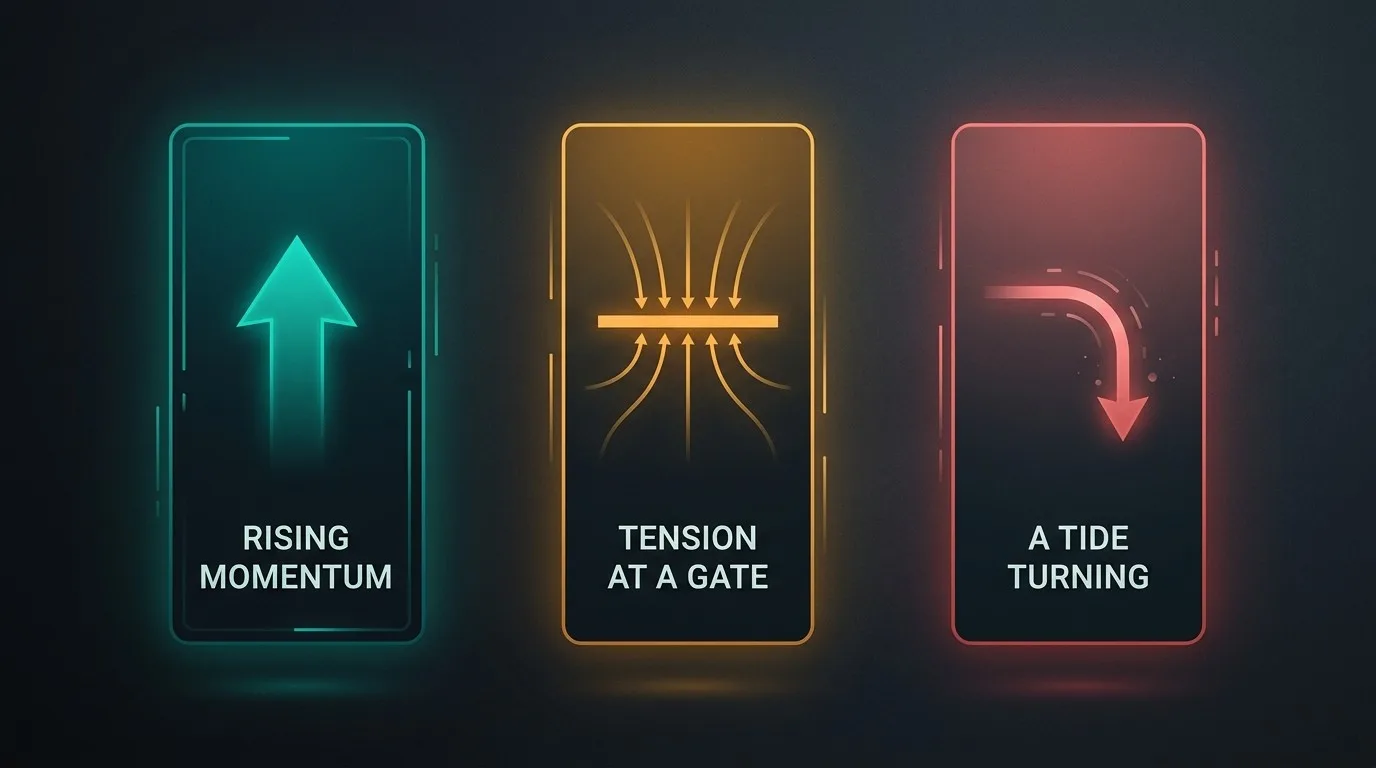
Three Contexts That Determine Which Signal Wins

Signal priority shifts depending on whether the market is trending, sitting near a structural level, or showing signs of reversal. In a trend, momentum and trend indicators carry more weight than flow. Near a defended level, flow and positioning override momentum. At potential reversals, exhaustion and structural breaks take priority over everything else. The context you're in determines which hierarchy applies.
Trending Markets: Momentum Leads
When price is in a confirmed trend (higher highs and higher lows on the 15-minute, or lower lows on a swing timeframe), momentum and trend indicators carry the most weight. Velocity expanding, ADX above 25, Supertrend aligned, MACD histogram growing: these are the dominant signals.
Flow metrics like CVD can lag in a strong trend because passive sellers step away rather than aggressively hitting bids. OBV might flatten while price continues higher, not because the trend is weak but because volume naturally clusters at breakout points and thins during continuation. A trader who exits a trending position because CVD looks flat is misreading which dimension matters in that specific context.
Consider SPY in a sustained intraday uptrend. Velocity is at the 72nd session percentile and expanding. Supertrend has been bullish for 14 bars. But CVD has been flat for the last 30 minutes. The momentum context says hold. The flow context says caution, not reversal. A trader who weights these equally would freeze. A trader who knows momentum leads in trends would hold with a tighter stop and re-evaluate if momentum itself deteriorates.
The hierarchy in a trend: momentum and trend structure first, volume confirmation second, flow third. A temporary CVD divergence during strong momentum is a reason to watch more closely, not a reason to reverse your thesis.
Near Key Levels: Flow and Positioning Lead
When price approaches a significant structural level, the hierarchy flips. Momentum can carry price into a level, but whether that level holds or breaks depends on what's happening beneath the surface.
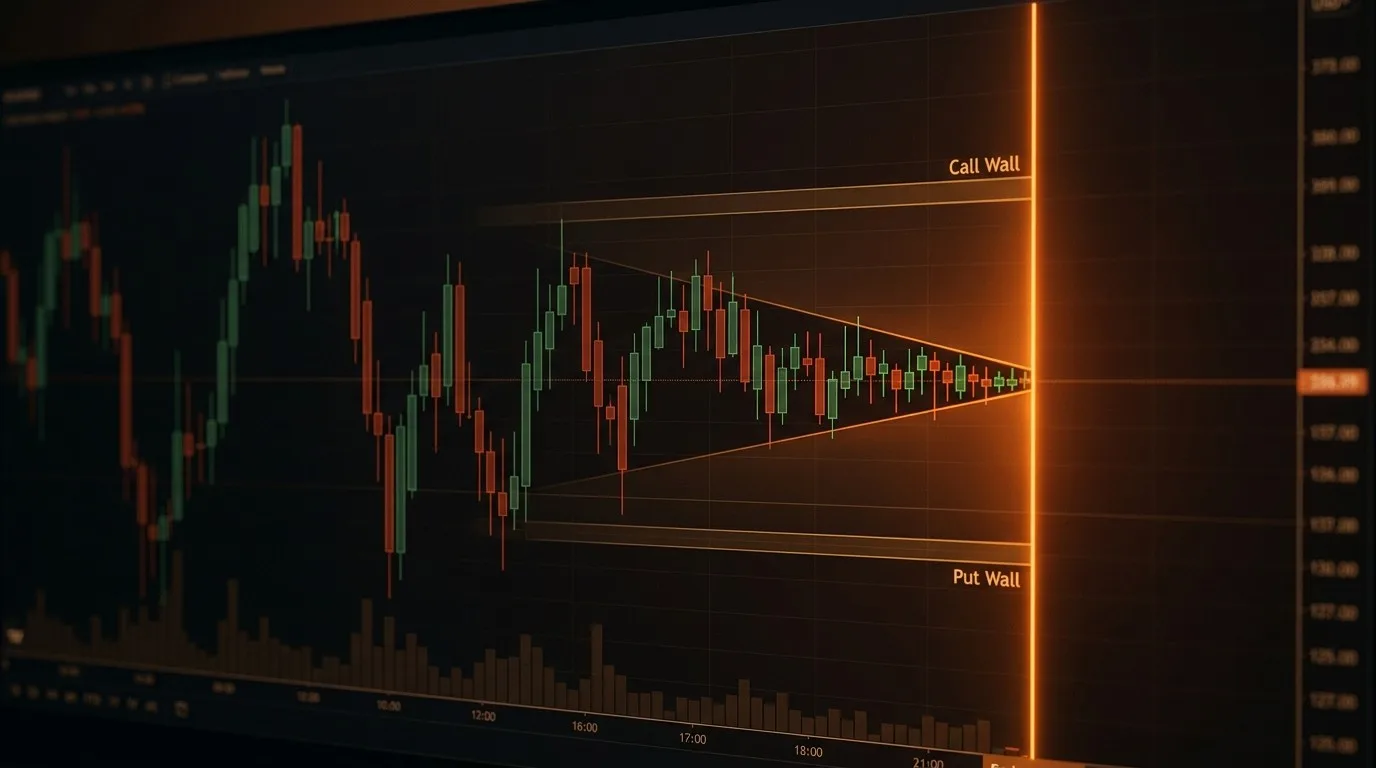
A bullish trend pushing into a strike with heavy call open interest concentration is a different setup than a bullish trend pushing into open space. Options positioning creates mechanical resistance through market maker hedging, and that force operates independently of what momentum indicators show on the chart. Similarly, price approaching an untested order block where CVD suddenly shows aggressive buying means something different than price approaching the same level with passive, thin flow.
Near levels, the priority is flow first: is CVD confirming the directional push or diverging? Is the order book showing absorption at the level or genuine breakout participation? Then positioning: what does OI concentration look like at this strike? Is the gamma environment positive (stabilizing) or negative (amplifying)? Momentum becomes the third consideration rather than the first.
If momentum says go but flow and positioning say the level is defended, respect the flow. Momentum can always resume after a rejection. A bad entry near a defended level is harder to recover from than a missed continuation.
Potential Reversals: Structure and Exhaustion Override
At potential turning points, a third hierarchy applies. Neither momentum nor flow alone determines whether a reversal is real. Structural signals do.
A Change of Character (CHOCH), the first break against the prevailing trend, is a higher-priority signal than a momentum oscillator divergence. CHOCH represents a structural violation: the sequence of higher highs and higher lows (or vice versa) has broken. That's a fact about market structure, not a reading on an oscillator that might reset.
Exhaustion signals compound the structural read. When velocity decelerates across successive swings, when swing duration expands well beyond the session average, and when multiple metrics simultaneously reach statistical extremes, the reversal case strengthens regardless of what any single momentum indicator shows. Alexander Elder's early work on indicator families noted that oscillators from the same family (RSI, Stochastic, CCI) often agree with each other while disagreeing with trend or volume tools (Elder, Trading for a Living, 1993). At reversals, this distinction matters enormously: three momentum oscillators all saying "overbought" is one signal category, not three independent confirmations.
The hierarchy at potential reversals: structure first (CHOCH, break of key levels), exhaustion second (velocity deceleration, swing duration expansion, combined extremes), flow confirmation third (CVD direction, aggressive versus passive participation). Momentum oscillator readings at this stage often lag because they need several candles to reflect a structural change that has already happened in price.
When the Conflict Itself Is the Signal
Sometimes the most useful information isn't in any individual signal but in the fact that signals disagree. When multiple independent data dimensions point in contradictory directions with roughly equal conviction, the market hasn't committed to a direction. Treating that ambiguity as a distinct market condition rather than a problem to solve often produces better outcomes than forcing a directional read.
Not every conflict resolves neatly. When trend indicators point up, flow metrics point down, and positioning is neutral, genuine disagreement is present. Forcing a directional trade in this environment means taking a side before the market has. The expected outcome is noise, whipsaw, or a mean-reversion move that stops out both sides.
The practical response is to reduce position size or stand aside entirely. This isn't indecision dressed up as a framework. It's the recognition that a 2-out-of-5 independent category confluence score doesn't justify standard risk. If your threshold is three or more independent signal categories agreeing before you commit full size, then a conflicted market scoring one or two is a no-trade condition by your own rules.
The hardest part isn't understanding the framework. It's accepting that "no trade" is a legitimate output. The SEBI study on individual F&O traders found that 89% incurred net losses (SEBI, "Study: Analysis of Profit and Loss of Individual Traders dealing in Equity F&O Segment," January 2023), and overtrading during ambiguous conditions is a significant contributor. Sometimes the data doesn't support a trade, and the disciplined response is to wait for a context where it does.
Resolving Conflict Before Every Trade
Resolving conflicting signals in practice requires three steps applied before every entry: classify the current market context, apply the correct priority hierarchy for that context, and accept the output even when it means standing aside. The process takes thirty seconds once the framework is internalized, and it prevents the freeze-or-ignore pattern that erodes returns.
- Step 1: Classify the context. Is the market trending, sitting near a structural level, or showing potential reversal signs? This classification determines which hierarchy applies. If you can't classify confidently, treat that uncertainty as a signal of regime transition, which itself is a reason for smaller size.
- Step 2: Apply the hierarchy. In a trend, weight momentum and trend structure most heavily. Near a level, weight flow and positioning. At a potential reversal, weight structure and exhaustion. If the dominant dimension for this context supports your trade thesis, proceed. If it contradicts, respect it regardless of what secondary dimensions show.
- Step 3: Score the conflict. Count how many independent signal categories support the trade. If the count falls below your minimum threshold (three independent categories is a reasonable floor for standard sizing), either reduce size proportionally or pass entirely. This scoring approach connects directly to the conviction-based sizing framework: lower conviction means smaller position, not necessarily no position.
Checking five independent dimensions manually across multiple timeframes, reconciling them, and classifying the context under time pressure is demanding work. This is where synthesis changes the equation. Draconic, an AI trading intelligence platform, synthesizes across trend, momentum, flow, structure, and positioning simultaneously and surfaces where they agree and where they conflict.
A question like "SPY looks bullish on the 15-minute but flow feels weak near this level. What am I missing?" returns a structured assessment showing which dimensions agree, which conflict, and what the current market context suggests about priority. The trader still makes every decision. But the conflict is visible and organized rather than scattered across six open tabs.
The chart said buy. The flow said wait. The options chain said something different.
Before this framework, that situation was a coin flip dressed in analysis. Now it's a solvable sequence: classify, prioritize, score. Sometimes the answer is "go." Sometimes it's "not yet." And sometimes the answer is that the market hasn't decided, so you shouldn't either.
That last answer might be the most valuable one of all.
More like this
May 12, 2026behind-the-price
Sector Rotation — The Macro Signal Most Traders Ignore
The Draconic Team • 3 min
May 11, 2026behind-the-price
How Market Makers Create Invisible Floors and Ceilings
The Draconic Team • 11 min
May 8, 2026behind-the-price
The Magnetic Levels — Why Price Gets Drawn to Certain Numbers Near Expiry
The Draconic Team • 8 min
May 7, 2026behind-the-price
When Three Flow Signals Agree Against Price
The Draconic Team • 4 min