Sector Rotation — The Macro Signal Most Traders Ignore
What is sector rotation?
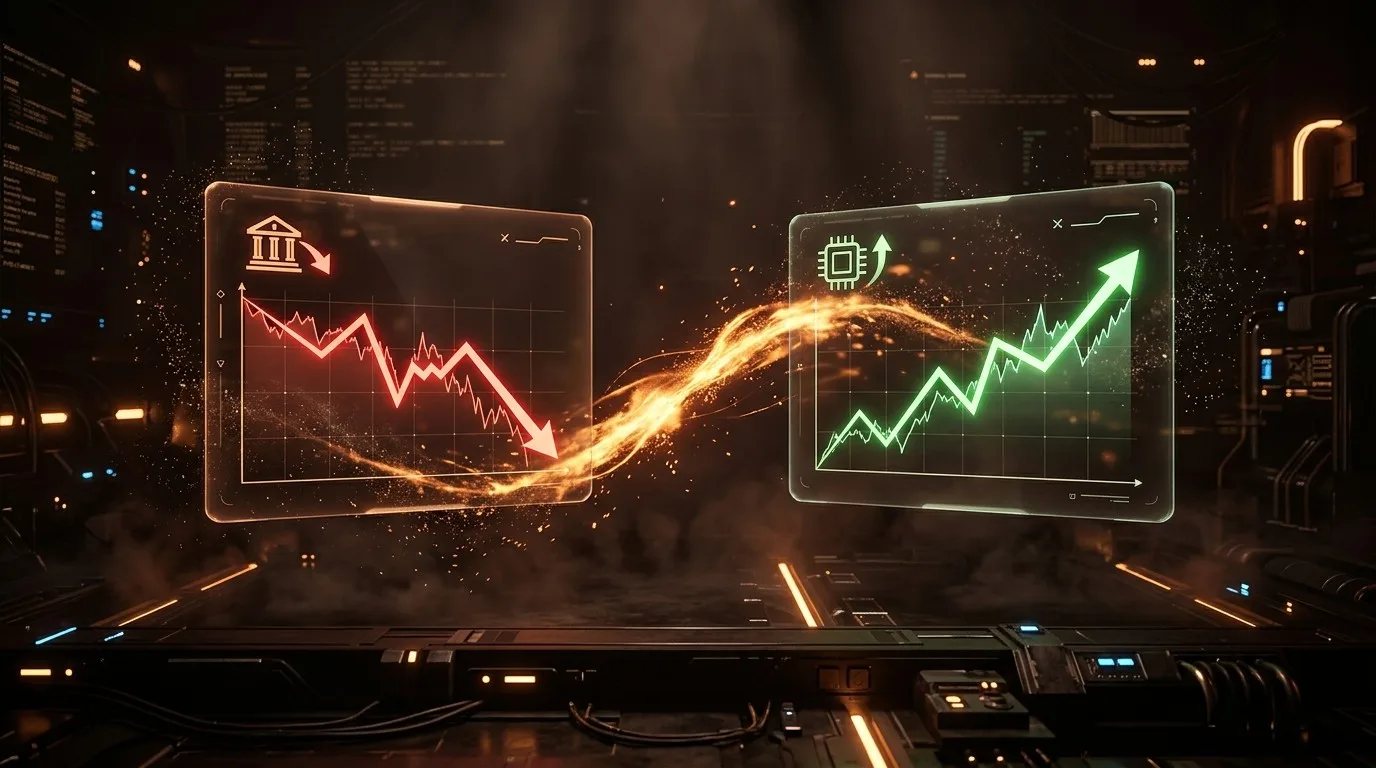
Sector rotation is the movement of institutional capital between industry groups (Banking to IT, Tech to Financials), driven by shifts in interest rate expectations, economic cycle positioning, and risk appetite. In Indian markets, capital often migrates between Bank Nifty and NIFTY IT one to three sessions before index price confirms the move. Reading rotation as a timing filter, not a direction signal, sharpens position sizing and filters out trades that fight the macro current.
Bank Nifty sold off 3% in two sessions. Your puts printed, and the chart told a Bank Nifty story. It wasn't one. Banking was rotating into IT after RBI commentary shifted rate expectations, and the same decline showed up across HDFC Bank, ICICI Bank, and SBI simultaneously. If you'd recognized sector rotation as the driver, you'd have sized bigger and held longer. That context was available before the index chart confirmed anything.
How Capital Moves Between Sectors
Sector rotation is the movement of institutional capital from one industry group to another, driven by shifts in interest rate expectations, economic cycle positioning, and risk appetite. It explains why clusters of stocks move in tandem in ways that single-instrument analysis misses, and it often leads index price by one to three sessions.
In India, the most persistent rotation pair is Banking versus IT. When RBI signals a hawkish stance or pauses rate cuts, banking stocks benefit from wider net interest margins while IT faces pressure from rupee strength and tighter global liquidity. When rate-cut expectations build, the dynamic flips. This isn't random. Moskowitz and Grinblatt documented the broader phenomenon in their 1999 Journal of Finance study "Do Industries Explain Momentum?", finding that industry-level momentum accounts for a significant portion of individual stock returns across markets. The sector rotation trading strategy that works in India follows the same structural logic observed in every major equity market they studied.
The US equivalent plays out between XLF (Financials) and XLK (Technology). Tightening favors financials. Easing favors growth-heavy tech. The instruments are different, but the rotation mechanic is identical.
Three Signals That Show Rotation in Progress
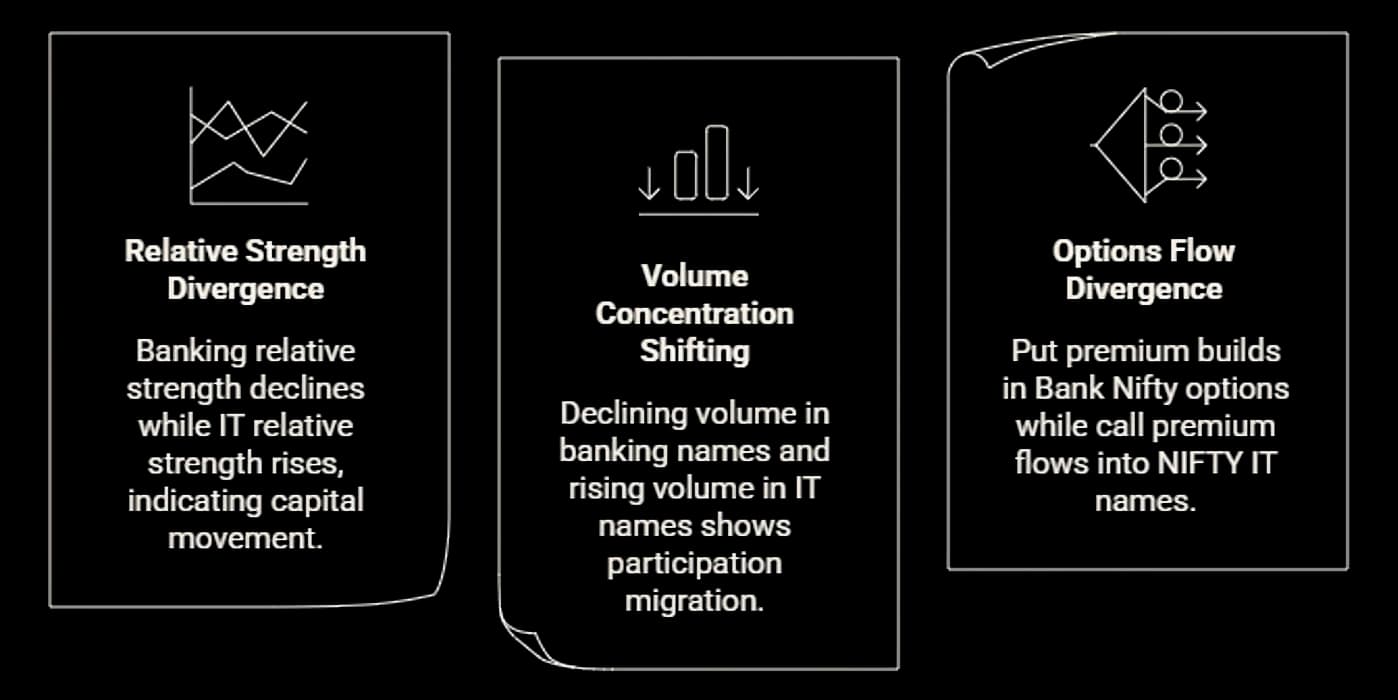
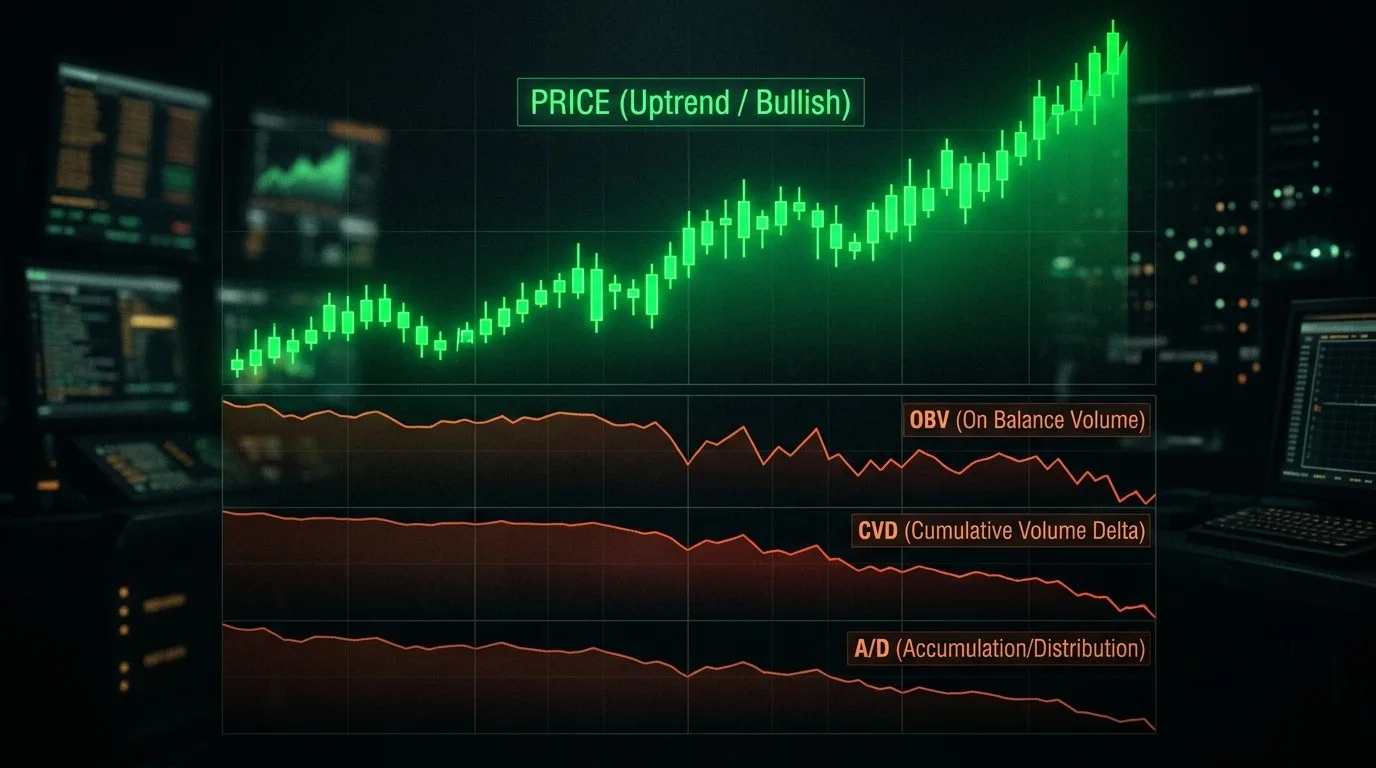
Sector rotation becomes readable through three signals that typically appear before index-level price confirms the shift: relative strength divergence between sector indices, volume concentration migrating from one group to another, and options flow tilting in a direction that cash market prices haven't yet reflected.
- Relative strength divergence. When Banking relative strength against NIFTY starts declining while IT relative strength rises, capital is already in motion. This signal often leads the visible price shift by one to two sessions because it captures the accumulation phase. The same comparison between XLF and XLK relative to SPY works for US markets.
- Volume concentration shifting. Declining volume in banking names alongside rising volume in IT names reveals where participation is migrating. NSE's daily Market Activity Reports include sector-wise turnover breakdowns that make this directly observable. A 3% Bank Nifty drop on above-average volume while NIFTY IT advances on expanding volume tells a clearer rotation story than either index alone.
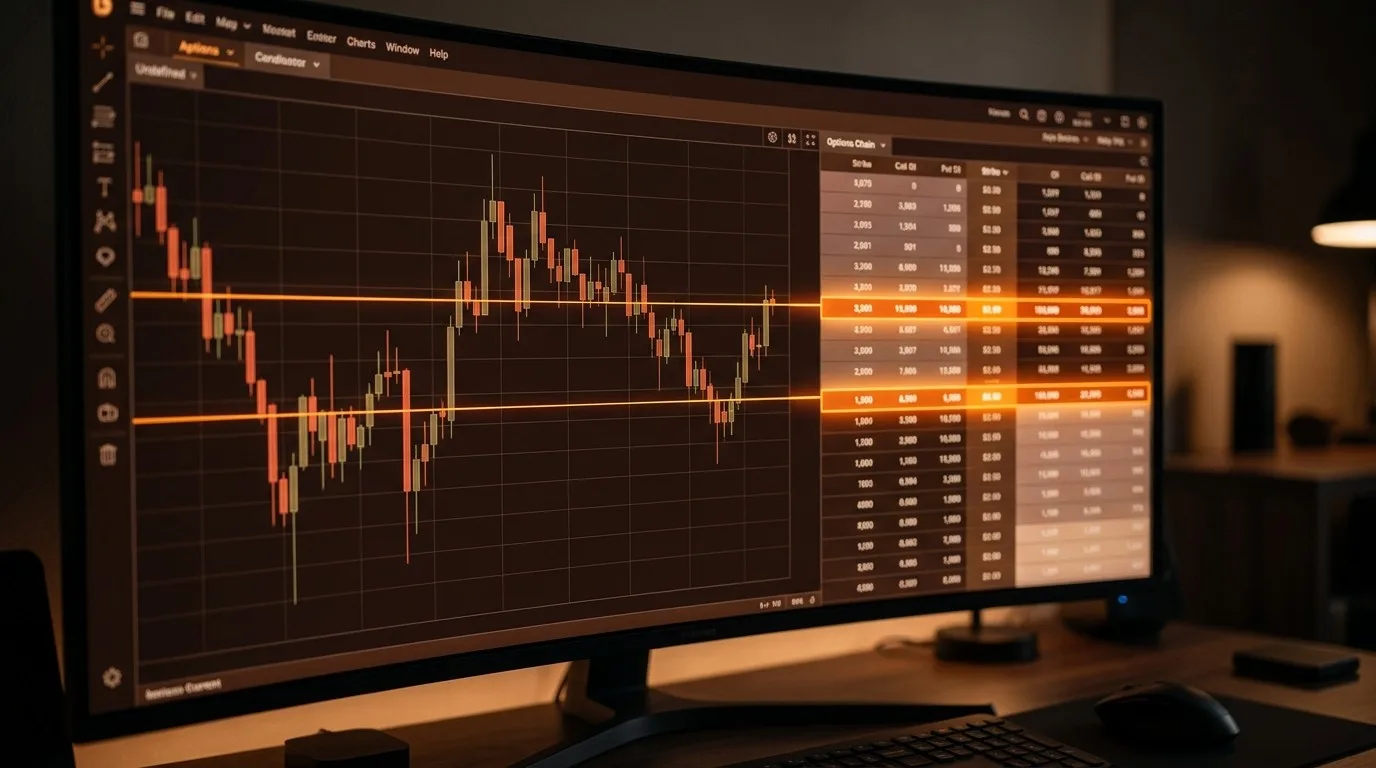
- Options flow divergence. When put premium builds in Bank Nifty options while call premium flows into NIFTY IT names, the derivatives market is pricing the rotation before cash catches up. Institutions position in options before moving large cash positions, so options flow divergence often precedes the sector shift visible on charts. This connects to how institutional options positioning creates gravity at specific price levels near expiry.
Using Rotation as a Timing Filter
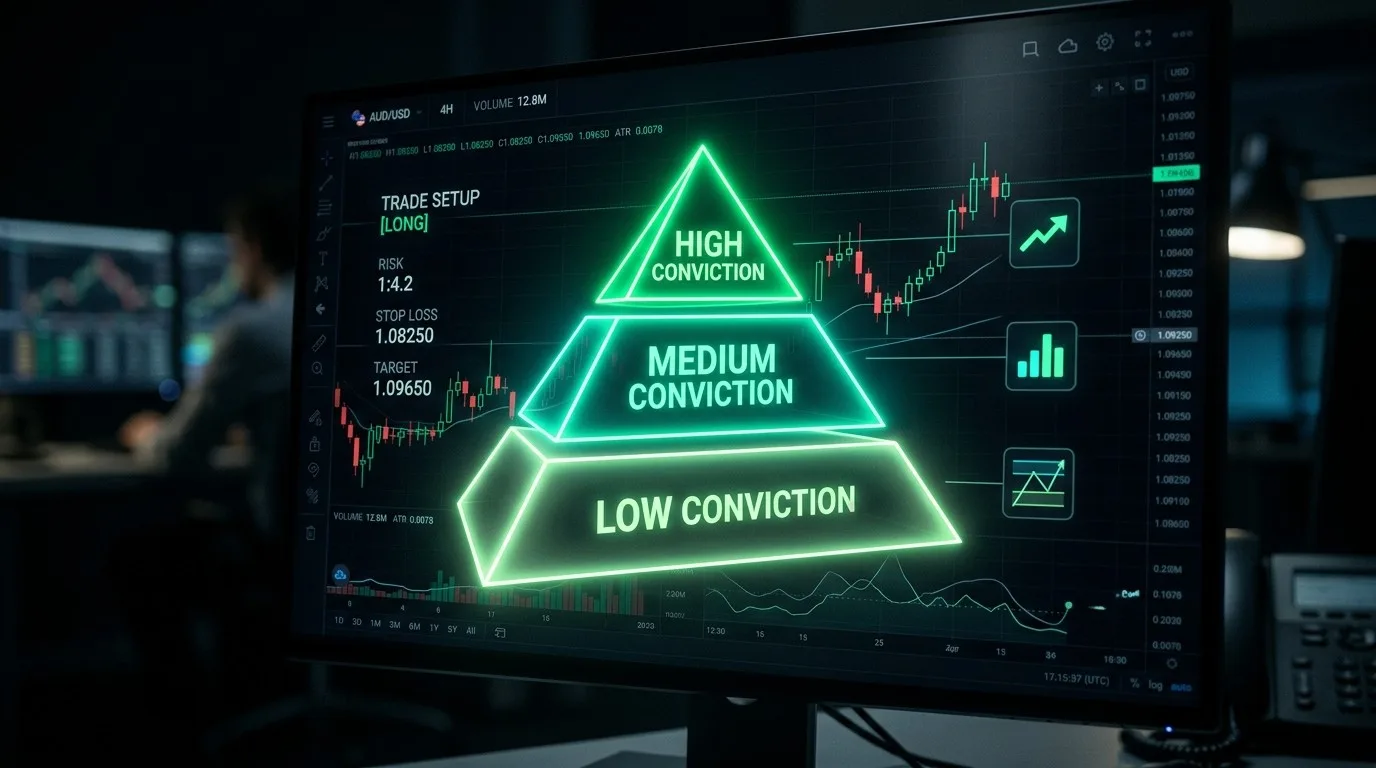
Sector rotation isn't a directional trading signal on its own. It's a context layer that sharpens conviction sizing and filters out trades fighting the macro current. When sector-level capital flow contradicts your index thesis, that changes the trade even when single-instrument analysis looks clean.
Consider a bullish Bank Nifty position while Banking relative strength is deteriorating against IT. The chart looks solid, indicators confirm. But the top five banking stocks account for roughly 60% of Bank Nifty's index weight (NSE, "NIFTY Bank Index Methodology," 2024), and when all five are losing relative strength simultaneously, the index faces a headwind that no candlestick pattern or momentum oscillator can override. That's a reduce-size or stand-aside situation.
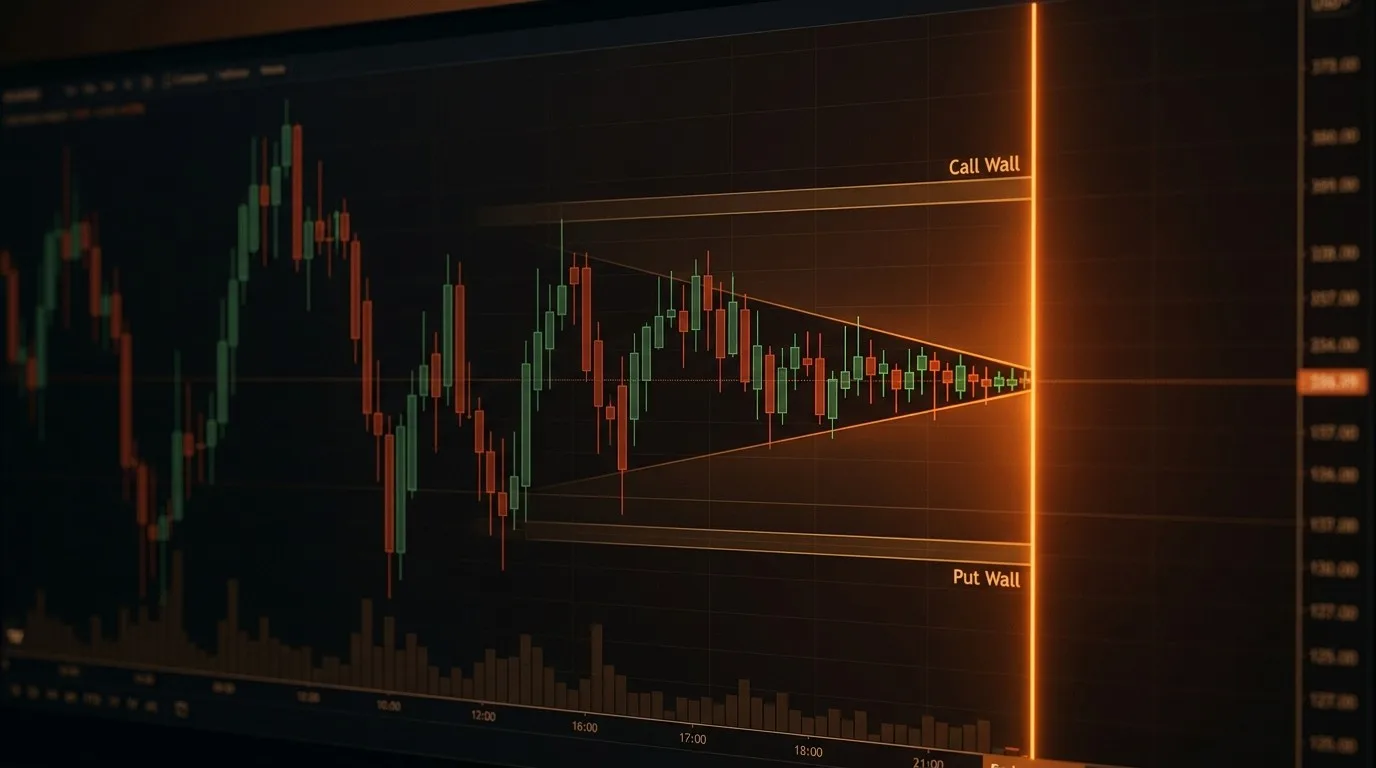
The signal becomes sharper when paired with volatility context. If Banking rotation is active while India VIX is elevated, the premium dynamics and directional probabilities for Bank Nifty options shift together in ways that either factor alone wouldn't reveal.
Fitting rotation into your pre-trade process takes one additional step. Before committing to any index options position, check whether sector-level capital flow supports or contradicts the thesis. That single check connects to the broader second opinion habit that separates systematic traders from impulsive ones.
Draconic, an AI trading intelligence platform, synthesizes sector rotation data alongside price dynamics, options positioning, and multi-timeframe context in one view. Instead of toggling between NSE sector indices, options chain data, and relative strength charts, you surface the full rotation picture in a single question.
Your next Bank Nifty trade will either have the macro wind at its back or pushing against it. Sector rotation tells you which before the index chart does. Ignoring it means placing a directional bet without knowing where capital is already flowing.
More like this
May 11, 2026behind-the-price
How Market Makers Create Invisible Floors and Ceilings
The Draconic Team • 11 min
May 8, 2026behind-the-price
The Magnetic Levels — Why Price Gets Drawn to Certain Numbers Near Expiry
The Draconic Team • 8 min
May 7, 2026behind-the-price
When Three Flow Signals Agree Against Price
The Draconic Team • 4 min
May 6, 2026reading-the-trade
Position Sizing Strategy: A Conviction-Based Framework for Day Traders
The Draconic Team • 11 min