When Three Flow Signals Agree Against Price
What is volume divergence in trading?
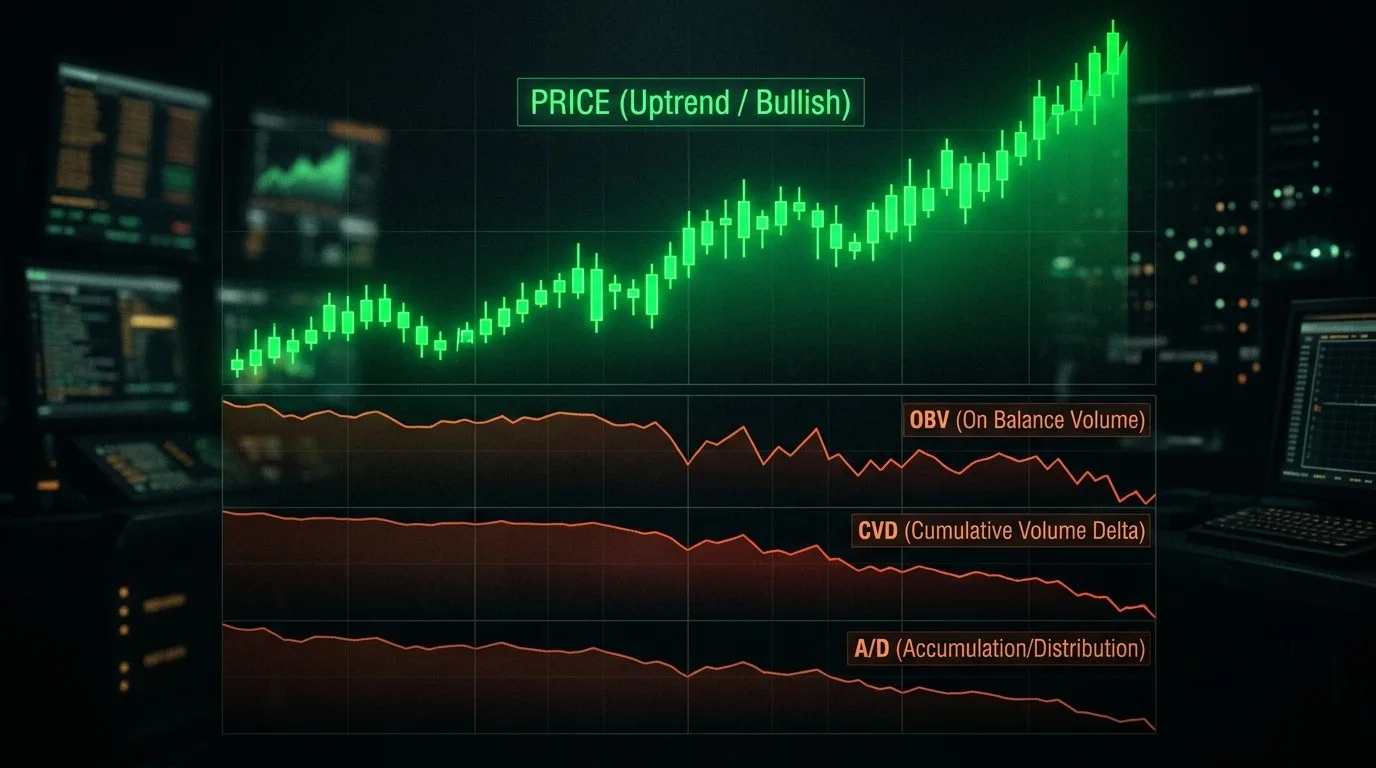
Volume divergence is when price makes new highs (or lows) but volume-based indicators move in the opposite direction, signaling that the underlying flow doesn't support the move. A single divergence is unreliable. When three independent flow measurements disagree with price at once (OBV for cumulative volume direction, CVD for aggressor intent, A/D for intra-candle close position), that's institutional distribution hiding behind a rally that still looks textbook on the chart.
Price is making higher highs. The chart looks textbook bullish. But underneath the surface, three separate measurements of buying and selling activity are all quietly declining.
Most traders catch this kind of volume divergence with a single indicator and treat it as a maybe. One divergence is easy to dismiss as noise. But when three independent flow measurements contradict price simultaneously, the odds that all three are wrong at once shrink dramatically — which is exactly why Draconic weights agreement across independent flow signals far more heavily than any single indicator. That's not a maybe. That's institutional distribution hiding behind a healthy chart.
Why One Volume Divergence Tells You Almost Nothing
A single flow divergence between price and a volume indicator is common and unreliable on its own. Each volume metric captures only one slice of market activity, and false signals appear regularly. The signal becomes meaningful when three independent measurements, each tracking a genuinely different dimension of flow, all contradict price simultaneously.
Research confirms that volume carries information about future price changes beyond what price history alone reveals (Blume, Easley, & O'Hara, "Market Statistics and Technical Analysis: The Role of Volume," Journal of Finance, 1994). The challenge is extracting that information cleanly. Three metrics built on different mechanics give you three independent reads on the same question: is money actually flowing into this rally, or out of it?
OBV: Cumulative Volume Direction
OBV adds the full session's volume on days price closes higher and subtracts it when price closes lower. The running total shows cumulative volume commitment over time. Joe Granville introduced the concept in 1963 on a simple premise: volume leads price (Granville, Granville's New Key to Stock Market Profits, 1963).
When price pushes to a new high but OBV doesn't follow, the advance is happening on declining volume participation. That's a yellow flag on its own. Not a red one. OBV divergence alone fires often enough that acting on it in isolation leads to premature exits.
CVD: Aggressor Intent
Cumulative Volume Delta captures something OBV misses entirely: who initiated each trade. Every transaction has a buyer and a seller, but one side crossed the spread to make it happen. Trades executed at the ask price are buyer-initiated. Trades at the bid are seller-initiated. CVD tracks the running difference between the two.
This distinction matters because a passive advance and an aggressive advance look identical on a price chart. In a passive advance, sellers step back and price drifts higher without genuine buying urgency. CVD falling while price rises exposes the difference. Lee and Ready's 1991 classification framework established the methodology for identifying trade initiators from intraday data (Lee & Ready, "Inferring Trade Direction from Intraday Data," Journal of Finance, 1991).
Applicability note: CVD requires centralized exchange data with trade-level classification. It works reliably for stocks, indices, futures, and centralized crypto exchanges. It is limited or unavailable for decentralized crypto and most retail forex aggregators.
A/D: Where Price Closes Within the Bar
The Accumulation/Distribution line, developed by Marc Chaikin, asks a question neither OBV nor CVD answers: where did price close relative to its full high-low range, and how much volume accompanied that close position?
When institutions sell into a rally, price may still close higher on the day, but it finishes near the bottom of the bar's range. The A/D line weights each session's volume by that close position. A/D falling while price rises signals that within each candle, sellers are controlling where price settles, even when the daily close itself is green.
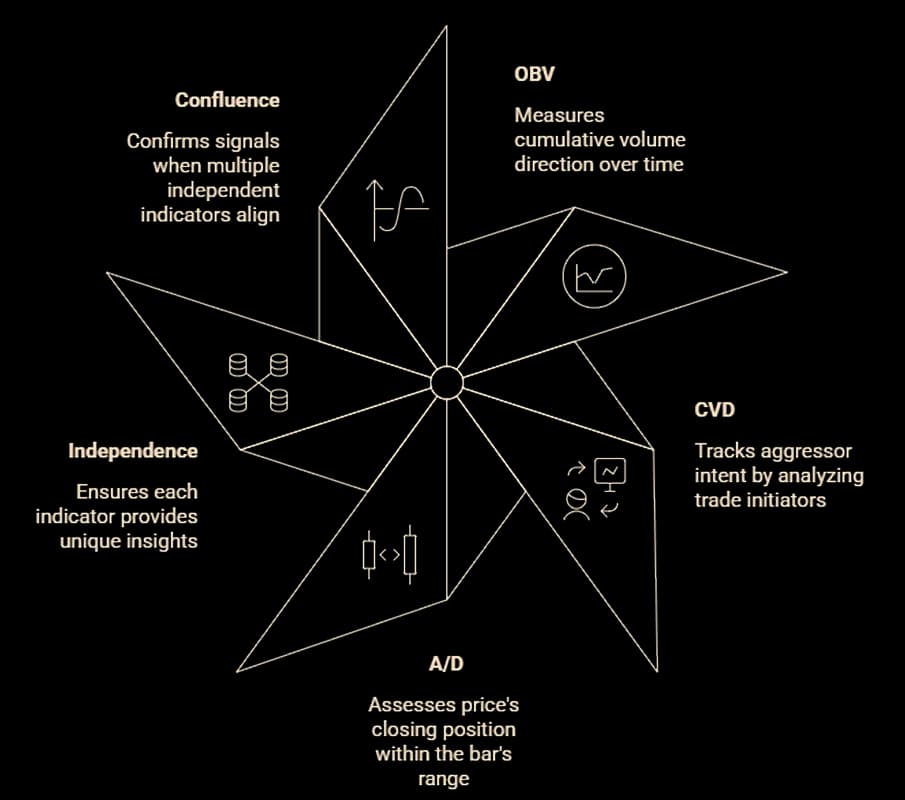
Why Independence Is the Point
OBV measures cumulative volume direction across days. CVD measures aggressor intent within each session. A/D measures the close's position within each candle's range. These aren't three versions of the same calculation. They track fundamentally different aspects of how money moves through a market.
This is the same principle that separates real confluence from false confluence in technical analysis: correlated indicators repeating the same story isn't confirmation, it's redundancy. Independent signals pointing the same direction is genuine triple flow confirmation.
When OBV, CVD, and A/D all diverge against a rising price, you're seeing volume direction, aggressor intent, and intra-candle positioning each independently questioning the rally's foundation. Three witnesses who don't know each other, all telling the same story.
What to Do When All Three Disagree With Price
Triple flow divergence doesn't signal an immediate reversal. It signals that the current trend's durability is in question across three independent dimensions, and the practical response is to tighten risk, adjust expectations, and treat the next pullback as potentially structural rather than a routine buying opportunity.
For a trader watching SPY grind to new highs while all three flow signals weaken: tighten trailing stops, reduce new long exposure, and plan for the possibility that the next pullback doesn't bounce. For a NIFTY options trader seeing the same pattern, the question shifts from "which strike for the next leg up?" to "is this rally worth committing fresh premium to?"
Checking flow confirmation before entering any trade in the direction of price is the simplest version of the second opinion habit. Before committing capital, ask whether the money underneath actually supports the chart above.
Draconic, an AI trading intelligence platform, synthesizes OBV, CVD, and A/D alongside 176+ other metrics per candle. Rather than opening three indicator panels and visually comparing slopes, a single query surfaces whether flow confirms or contradicts price across all three dimensions at once.
Price tells you where the market went. Flow tells you who was behind it. One volume divergence is ambiguous enough to ignore. Three independent signals all contradicting price is a message worth hearing, because the cost of discovering it after the reversal is always higher than the cost of listening before.
More like this
May 12, 2026behind-the-price
Sector Rotation — The Macro Signal Most Traders Ignore
The Draconic Team • 3 min
May 11, 2026behind-the-price
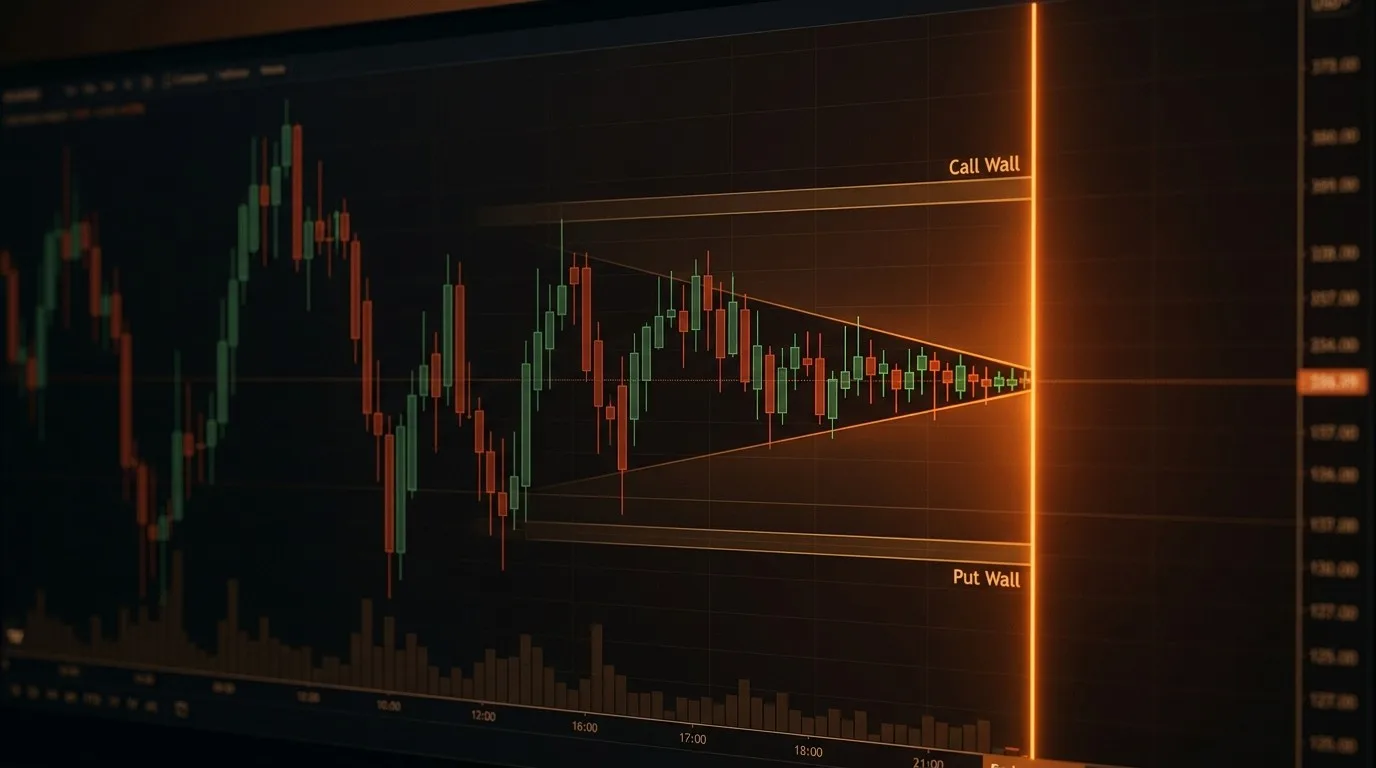
How Market Makers Create Invisible Floors and Ceilings
The Draconic Team • 11 min
May 8, 2026behind-the-price
The Magnetic Levels — Why Price Gets Drawn to Certain Numbers Near Expiry
The Draconic Team • 8 min
May 6, 2026reading-the-trade
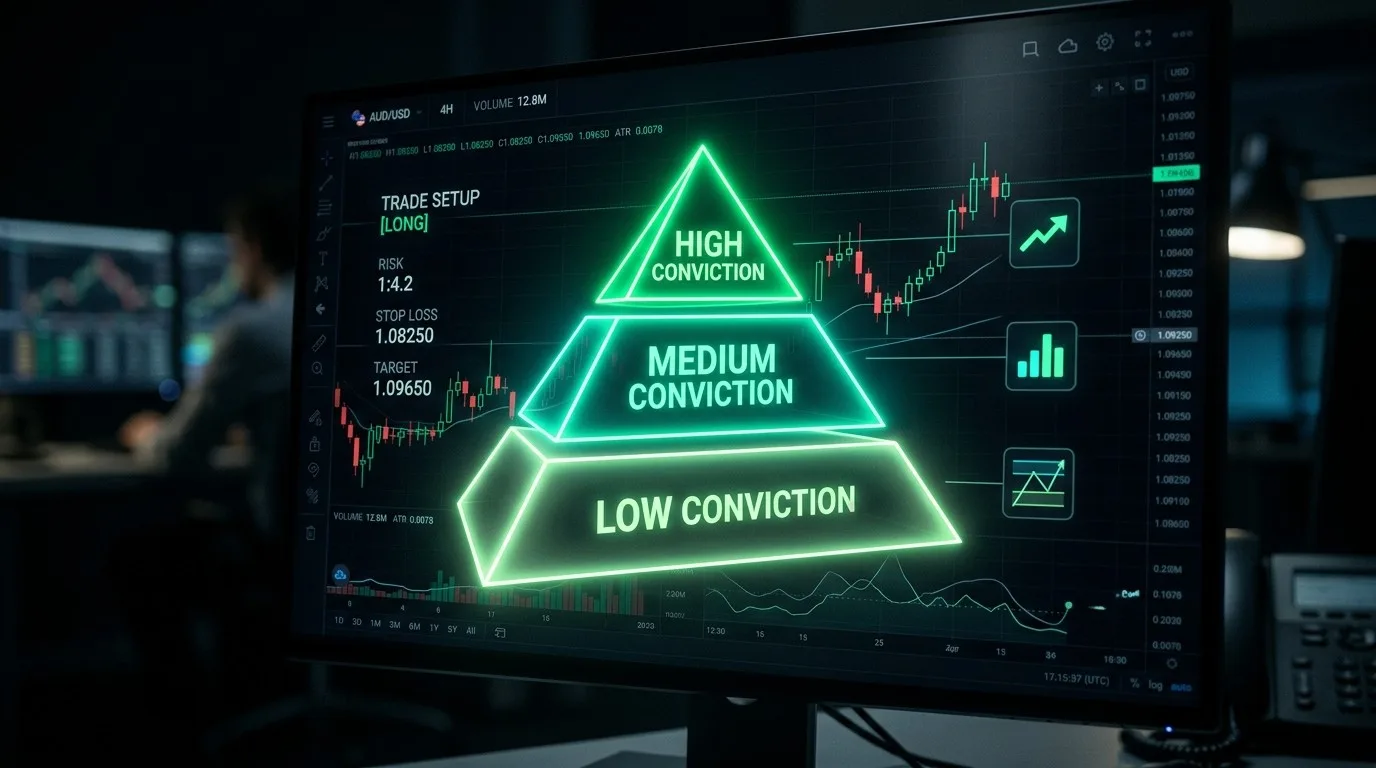
Position Sizing Strategy: A Conviction-Based Framework for Day Traders
The Draconic Team • 11 min