The Magnetic Levels — Why Price Gets Drawn to Certain Numbers Near Expiry
What is max pain in options trading?
Max pain is the price level at which the maximum value of outstanding options contracts expires worthless — where option sellers collectively retain the most premium. Near expiry, price gravitates there because the institutions and market makers who sold most of those contracts hedge their books in ways that nudge price toward it. Combined with the put wall (highest put OI) and call wall (highest call OI), these three levels create a gravitational range for NIFTY, Bank Nifty, and SPX in the final sessions before settlement.
Thursday afternoon. NIFTY has been drifting all day, and for the third consecutive weekly expiry, price is inching toward the same round number it seemed to ignore on Monday. Your chart shows no support there. No trendline. No moving average. And yet price settles within 30 points of 23,500 by close, as if something invisible is pulling it.
Thursday afternoon. NIFTY has been drifting all day, and for the third consecutive weekly expiry, price is inching toward the same round number it seemed to ignore on Monday. Your chart shows no support there. No trendline. No moving average. And yet price settles within 30 points of 23,500 by close, as if something invisible is pulling it.
You've seen this pattern before. The 500-point intervals on NIFTY, the 50-point marks on Bank Nifty in the final hours of expiry day. The gravity is consistent enough to feel intentional, but your charts offer no explanation for it.
That's because the force isn't on your chart. It's in the options chain. Near expiry, a completely different set of mechanics shapes where price gravitates. These mechanics have nothing to do with candlestick patterns, moving averages, or trendlines, and everything to do with where the most money is concentrated in outstanding options contracts.
How Open Interest Concentration Shapes Price Near Expiry
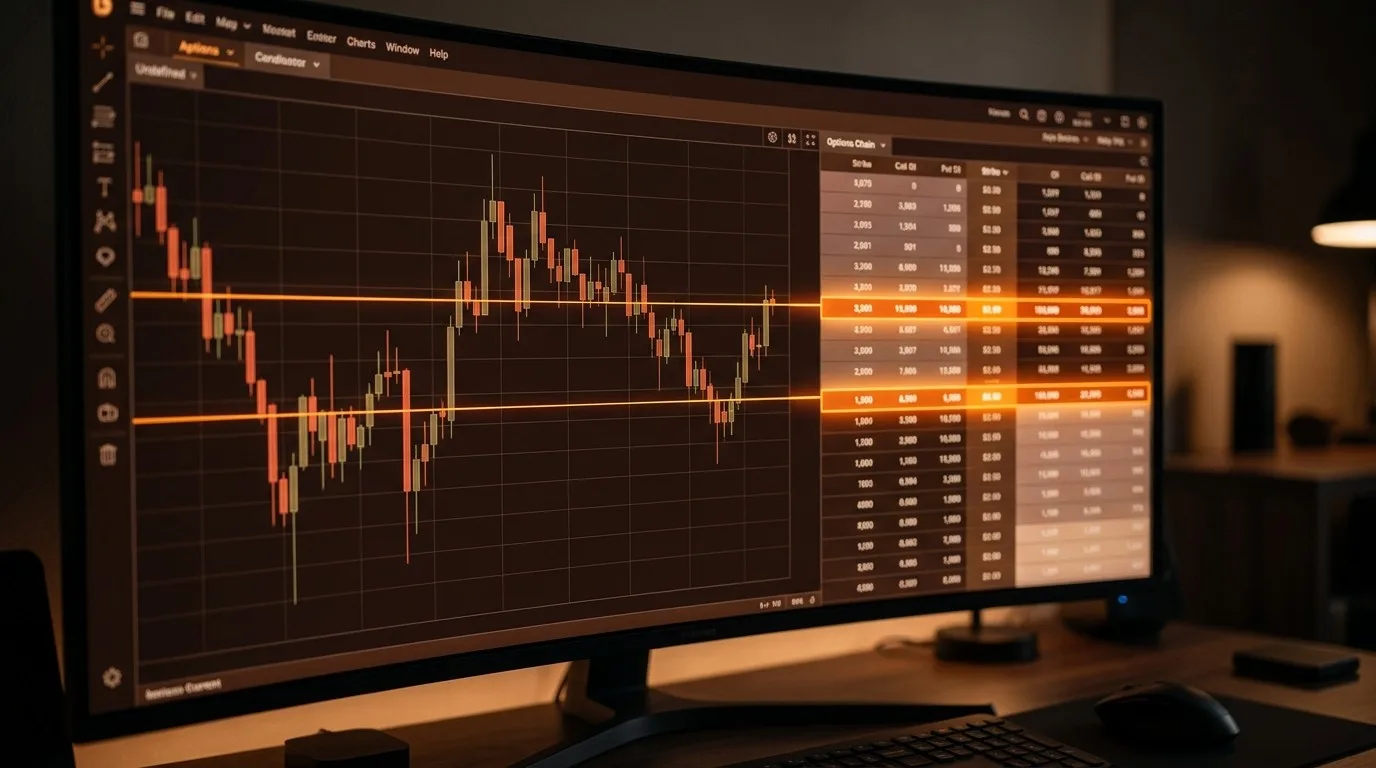
Open interest at specific strike prices represents the total number of outstanding options contracts that haven't been closed or exercised, and strikes with the highest concentration act as gravitational anchors for price in the final sessions before expiry because both buyers and sellers have strong financial incentives to defend or attack those levels.
Think of open interest as a map of where traders have placed their bets. On any given NIFTY monthly expiry, certain strikes accumulate far more contracts than others. The 23,000 strike might hold 15 million contracts while the 23,050 strike holds 2 million. That concentration isn't random. Round numbers attract positioning because they're psychologically significant, and institutional hedging strategies cluster around them.
The concentration matters because it creates opposing forces at those specific levels. If the 23,500 call strike has heavy open interest, call buyers need price above 23,500 to profit, while call sellers need it below. If the 23,000 put strike has heavy open interest, put buyers need price below 23,000, while put sellers need it above. These opposing interests create tension that pulls price toward the zones where the most contracts expire worthless.
The same dynamic plays out on SPX options in the US. Weekly Friday expiries on SPX show similar clustering around round strikes, with price often settling within a narrow band of the highest-OI levels in the final trading hours. Ni, Pearson, and Poteshman documented this effect in their 2005 study published in the Journal of Financial Economics, finding statistically significant stock price clustering on option expiration dates, driven by the hedging and unwinding activity of market participants holding large options positions.
What Max Pain Is and Why It Creates a Gravity Well
Max pain is the price level at which the maximum total value of outstanding options contracts expires worthless, meaning option sellers collectively retain the most premium at that specific settlement price. It functions as a gravitational center because the sellers of those contracts, typically institutions and market makers, have a structural financial incentive for price to settle there.
Here's the simplest way to think about it. For every options contract, there's a buyer and a seller. The buyer paid a premium hoping for a profitable move. The seller collected that premium hoping the contract expires worthless. At the max pain price, the largest possible dollar amount of contracts expires out of the money. The sellers keep their collected premium. The buyers lose theirs.
Consider a poker table analogy. In a casino, the house profits most when the most players bust. Max pain is the price where the options "house" profits most. The institutions and market makers who sold the bulk of those contracts have a structural incentive for price to gravitate toward that level, because that's where their aggregate collected premium is maximized.
This isn't a conspiracy. Nobody is illegally manipulating price to a specific number. It's incentive alignment. The participants with the largest positions and the most hedging activity happen to benefit when price settles near max pain, and their hedging adjustments in the final sessions naturally nudge price in that direction. Avellaneda and Lipkin formalized this dynamic in their 2003 paper "A market-induced mechanism for stock pinning," published in Quantitative Finance, showing that delta-hedging activity by options market makers creates a measurable pinning effect near option expiration.
For NIFTY monthly expiries, max pain typically sits near the strike with the heaviest combined put and call OI. You can calculate it yourself by summing the total intrinsic value loss across all strikes at each possible settlement price, then finding the price where that total loss is highest. Or you can simply check where the OI-weighted pain calculation points before each expiry session.
On SPX, the same principle applies. Friday-expiry 0DTE options on SPX show a compressed version of this gravity, with max pain often exerting its pull within the final two hours of trading as gamma increases and hedging adjustments accelerate.
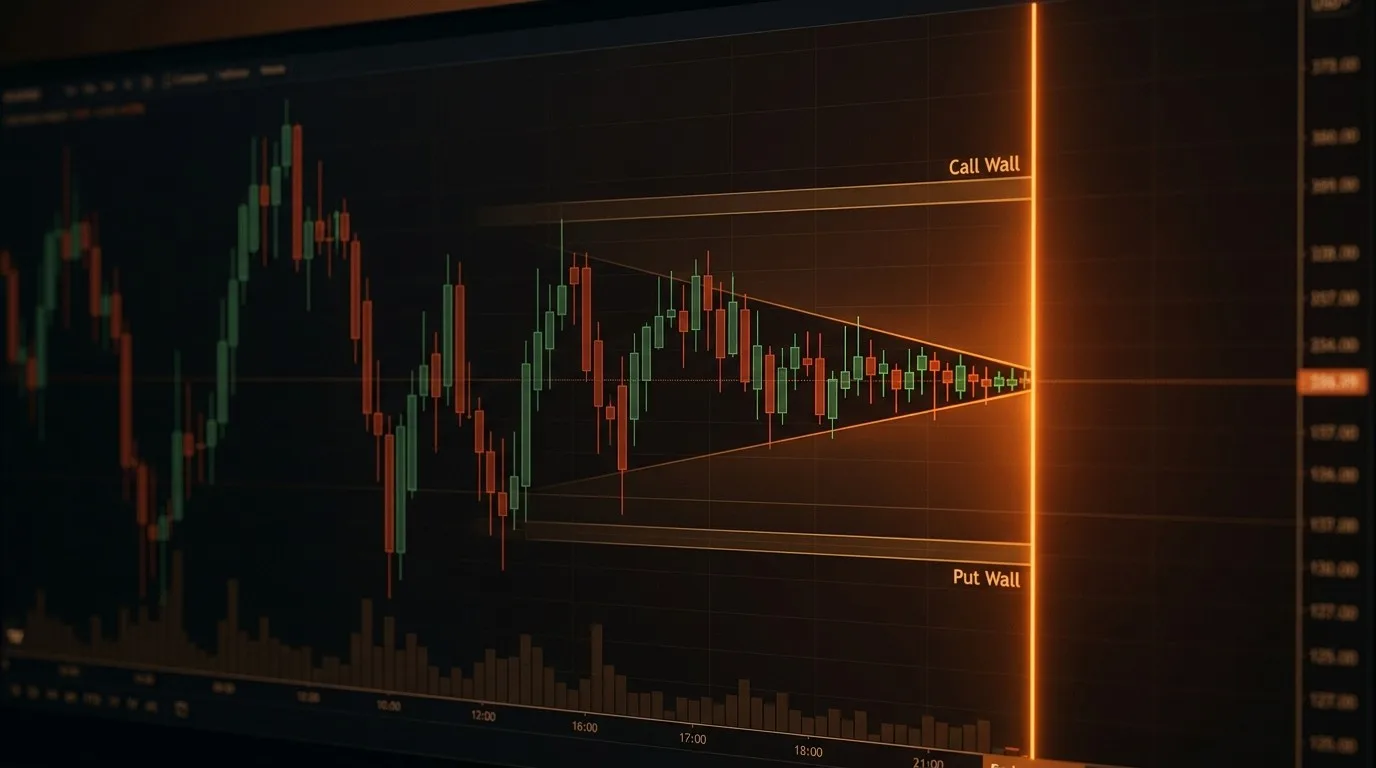
How Put Walls and Call Walls Create a Trading Range
The put wall is the strike with the highest put open interest, and the call wall is the strike with the highest call open interest. Together they define a floor and ceiling for price near expiry, because hedging by the sellers of those options creates mechanical buying pressure below the put wall and selling pressure above the call wall.
The put wall works as a floor because of how the sellers of those puts manage risk. If you sold thousands of 23,000 put contracts, you collected premium and now carry the obligation to buy NIFTY if it falls below 23,000. As price approaches 23,000, your risk increases and you need to hedge. That hedging involves buying the underlying or related futures, which creates buying pressure right around the put wall level. The heavier the put OI at that strike, the more buying pressure emerges as price approaches.
The call wall works as a ceiling through the opposite mechanic. Sellers of 23,500 call contracts carry the obligation to sell NIFTY if it rises above 23,500. As price approaches that level, they hedge by selling the underlying, creating selling pressure. Heavy call OI at a specific strike means concentrated selling pressure as price approaches from below.
Between the put wall and the call wall, price often oscillates in a defined range during the final sessions before expiry. The wider the gap between the two walls, the wider the expected range. When the walls are tight (say, 200 points apart on NIFTY), price tends to consolidate. When they're wide (500+ points apart), directional moves within the range are more likely but breakouts beyond either wall face significant hedging resistance.
This is important context for any directional trade you consider near expiry. If you're bullish on NIFTY but the call wall sits 50 points above current price, the hedging resistance above that level is a structural headwind that pure chart analysis won't show you. If you're bearish but the put wall is 100 points below, the mechanical buying pressure at that level is a floor your charts don't display.
SEBI's January 2023 study, "Analysis of Profit and Loss of Individual Traders dealing in Equity F&O Segment," found that 89% of individual traders in the Indian derivatives segment incurred net losses. While the study attributed losses to multiple factors, the structural information asymmetry around options positioning is one dimension where retail traders consistently operate at a disadvantage. Institutional participants can see and model the OI landscape, the max pain calculation, and the put/call wall positioning in real time. Most retail traders trade near expiry without any of this context.
What Happens After Expiry Resets the Board
After a major expiry, open interest resets and new positioning begins within the first 48 hours. These initial sessions typically show lower volume, wider bid-ask spreads, and fresh OI buildup at new strikes that reveals the early directional bias for the next cycle before most traders have redrawn their chart levels.
This post-expiry window is one of the most underwritten topics in options education, and it follows directly from understanding expiry mechanics. If OI concentration creates gravity, then the absence of that concentration immediately after expiry means the gravitational forces are temporarily gone. Price can move more freely. And the specific strikes where new OI starts building in the first two sessions tell you where the next cycle's gravity wells are forming.
Consider a practical example. Thursday's monthly NIFTY expiry settles at 23,480, near the max pain of 23,500. Friday morning, the slate is clean. By Friday afternoon, you notice heavy put writing at the 23,200 strike and heavy call writing at 23,800. The new put wall and call wall are forming, and the range they define is wider than the previous week's. That signals the options market expects a wider trading range in the coming cycle, which is itself useful context for sizing and stop placement.
On SPX, the cycle is even faster because of daily 0DTE expirations. The OI map resets every session, meaning the gravitational forces rebuild fresh each morning. For weekly and monthly SPX expiries, the post-expiry OI rebuild follows the same pattern, just compressed into hours rather than days.
Putting the Expiry Map Into Practice
The next time you're considering a directional trade within three sessions of a NIFTY or Bank Nifty expiry, check three things before committing. First, where is max pain for this expiry? If price is far from max pain on Wednesday, the gravitational pull toward it will intensify through Thursday. Second, where are the put wall and the call wall? These define the range price is most likely to respect. Third, does your directional thesis agree with or fight against these forces? A bullish trade toward the call wall is swimming with the current. A bullish trade through the call wall is swimming against concentrated hedging resistance.
None of this replaces your chart analysis. It adds a layer your chart can't show you. And that layer often explains why price "randomly" stopped at a level that had no visible support or resistance.
Draconic, an AI trading intelligence platform, synthesizes OI concentration, max pain, and put/call wall positioning alongside price dynamics, flow, and structural analysis in a single view. Instead of switching between your charting platform and the NSE options chain page, you can ask one question and see where the gravitational zones sit for this expiry, mapped against the technical and flow picture.
The chart shows where price has been. The options chain shows where the money is. Near expiry, the money often wins.
Frequently Asked Questions
Does max pain actually predict where NIFTY will settle on expiry day?
Max pain isn't a prediction. It's a measure of where the most options premium expires worthless, which creates a gravitational pull through hedging activity. Price doesn't always settle at max pain, but it gravitates toward it more often than chance would explain, particularly in the final trading session.
Max pain isn't a prediction. It's a measure of where the most options premium expires worthless, which creates a gravitational pull through hedging activity. Price doesn't always settle at max pain, but it gravitates toward it more often than chance would explain, particularly in the final trading session.
Can I use put wall and call wall levels as support and resistance?
Yes, with an important caveat. These levels represent hedging-driven mechanical pressure, not traditional chart-based support and resistance. They're strongest in the two to three sessions before expiry and weaken significantly after expiry resets the OI landscape. Use them as context alongside your existing levels, not as replacements.
Yes, with an important caveat. These levels represent hedging-driven mechanical pressure, not traditional chart-based support and resistance. They're strongest in the two to three sessions before expiry and weaken significantly after expiry resets the OI landscape. Use them as context alongside your existing levels, not as replacements.
Do these expiry mechanics work the same way for Bank Nifty weekly options?
The same principles apply, but Bank Nifty's weekly expiry cycle means the OI buildup and gravitational pull develop faster and reset more frequently. The put wall and call wall distances tend to be tighter on Bank Nifty weeklies because the time to expiry is shorter and the underlying is more volatile.
The same principles apply, but Bank Nifty's weekly expiry cycle means the OI buildup and gravitational pull develop faster and reset more frequently. The put wall and call wall distances tend to be tighter on Bank Nifty weeklies because the time to expiry is shorter and the underlying is more volatile.
How soon after expiry should I start watching new OI buildup?
The first two sessions after a major expiry are the window. By the end of the second session, the new put wall and call wall are typically established. For weekly Bank Nifty expiries, this window compresses to the first few hours of the new cycle.
The first two sessions after a major expiry are the window. By the end of the second session, the new put wall and call wall are typically established. For weekly Bank Nifty expiries, this window compresses to the first few hours of the new cycle.
Does this work for US options on SPX?
Yes. SPX options show similar OI concentration, max pain gravity, and put/call wall dynamics. The 0DTE expiry cycle on SPX means these forces rebuild daily, creating a faster gravitational cycle than NIFTY's weekly or monthly structure.
Yes. SPX options show similar OI concentration, max pain gravity, and put/call wall dynamics. The 0DTE expiry cycle on SPX means these forces rebuild daily, creating a faster gravitational cycle than NIFTY's weekly or monthly structure.
More like this
May 12, 2026behind-the-price
Sector Rotation — The Macro Signal Most Traders Ignore
The Draconic Team • 3 min
May 11, 2026behind-the-price
How Market Makers Create Invisible Floors and Ceilings
The Draconic Team • 11 min
May 7, 2026behind-the-price
When Three Flow Signals Agree Against Price
The Draconic Team • 4 min
May 6, 2026reading-the-trade
Position Sizing Strategy: A Conviction-Based Framework for Day Traders
The Draconic Team • 11 min