Reading the Invisible — CVD and Volume Profile
What is order flow trading and what do CVD and volume profile measure?
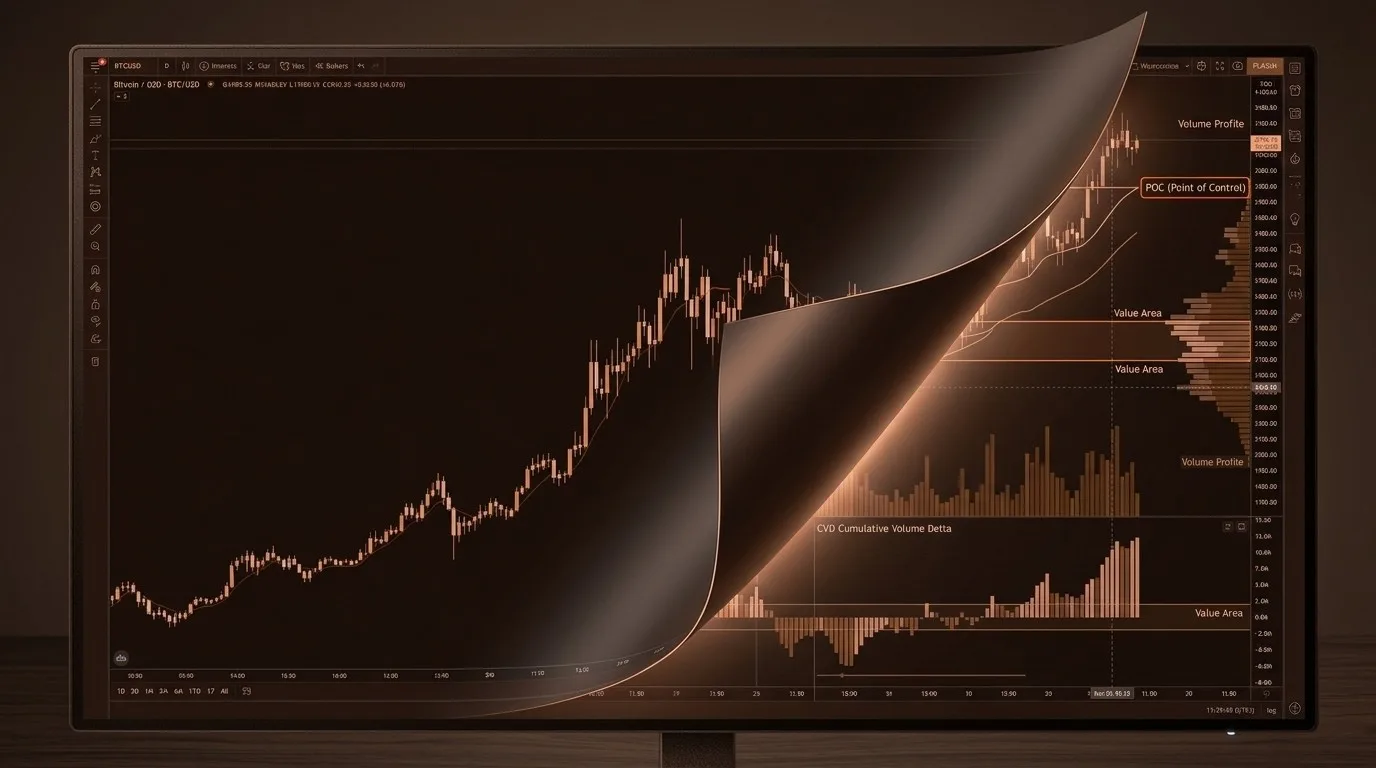
Standard charts show price; order flow shows participation and value structure beneath it. Cumulative volume delta (CVD) tracks aggression — trades at the ask (buyer-initiated) minus trades at the bid (seller-initiated). Rising CVD means buyers are lifting offers; flat CVD during a rally signals passive demand that collapses when sellers return. Volume profile maps accepted value: the Point of Control is the highest-volume price, the Value Area covers 70% of session volume, high volume nodes create friction, and low volume nodes let price accelerate. When both contradict the chart, two independent dimensions are telling you what price alone can't.
You watched NIFTY climb 80 points in the first hour. Every candle was green, momentum confirmed the direction, and you bought the pullback at 22,480. Forty minutes later, price reversed and you were stopped out.
The chart had looked healthy. But something beneath the surface had been falling apart for the entire rally, and nothing on your screen showed it. This is what order flow trading reveals: the hidden currents of participation and value that determine whether a move is real or running on empty. The gap between what the chart showed and what was actually happening underneath is the single most common reason traders with sound setups still get stopped out.
Two layers sit beneath every price chart. Cumulative volume delta tracks whether buyers are genuinely aggressive or merely present. Volume profile maps where the market has agreed on fair value and where it rejected prices entirely. Together they explain what happened to that NIFTY rally before the chart ever hinted at the reversal.
What Order Flow Reveals About the Quality of Every Move
Cumulative volume delta measures the net aggression in a market by tracking the running total of trades initiated at the ask price minus trades initiated at the bid. When CVD rises, buyers are lifting offers aggressively. When CVD falls, sellers are hitting bids. The distinction between aggressive and passive participation is what separates moves that sustain from moves that collapse.
Most price charts treat volume as a single bar beneath each candle. Volume was high, volume was low, volume "confirmed" the move. But that volume bar doesn't tell you which side initiated the trades. A stock can trade ten million shares in a session where every trade was seller-initiated at the bid, and the raw volume bar looks identical to a session where every trade was buyer-initiated at the ask. The directional intent is completely hidden in standard volume display.
CVD makes that intent visible. Research by Easley, Kiefer, O'Hara, and Paperman at Cornell University established in 1996 that trade initiation direction carries significant information about informed trading activity. Their work on the probability of informed trading demonstrated that the ratio of buyer-initiated to seller-initiated trades isn't noise. Institutional traders have used this signal for decades, while most retail traders still rely on aggregate volume bars that strip away the directional information entirely.
Here's what the distinction looks like in practice. NIFTY rallies 60 points and every candle is green. Standard volume looks healthy. But CVD is flat or declining through the rally. The move isn't being driven by aggressive buyers lifting offers. Instead, prices are rising because sellers are stepping back, pulling their offers, and letting price drift higher without resistance. This is passive demand, and it matters because passive rallies collapse the moment sellers return in size. The chart looks identical whether buying is aggressive or passive, but the durability of the move is completely different.
The most powerful CVD signal is divergence. Price makes a new high, but CVD fails to make a new high alongside it. Buyers aren't participating in the extension. A 2019 study by Chordia, Roll, and Subrahmanyam published in the Journal of Financial Economics confirmed that order flow imbalances measured through buyer-seller initiation ratios predict short-term price reversals with statistical significance across equity markets. CVD divergence captures exactly this dynamic in real time, because it shows participation shifting direction before price reflects the change.
CVD only works where exchange data classifies each trade as buyer-initiated or seller-initiated. That means stocks and indices on exchanges like NSE or NYSE, futures contracts, and centralized crypto exchanges like Binance or Coinbase. It doesn't work for decentralized crypto trading or most retail forex platforms where trade-level classification isn't available. Knowing where CVD applies prevents you from drawing conclusions from data that was never there.
How Volume Profile Maps Where Value Was Accepted
Volume profile organizes all traded volume by price level rather than by time, creating a horizontal histogram that reveals where the market spent the most time and transacted the most size. Prices with heavy volume represent accepted value. Prices with thin volume represent rejection, and this structure explains why certain levels produce friction and others don't.
The concept originates with J. Peter Steidlmayer, a trader at the Chicago Board of Trade who developed Market Profile in the 1980s. His core insight was that markets function as continuous auctions, searching for a price where buyers and sellers reach agreement. The price where the most volume trades represents that agreement, because both sides found it acceptable enough to transact in size. Steidlmayer's framework, later formalized in collaboration with the CBOT, established the foundation that modern volume profile analysis builds on.
Three levels define the structure. The Point of Control is the single price where the most volume traded in a session, and it acts as a gravitational center because it represents the market's strongest consensus on fair value. The Value Area High and Value Area Low mark the boundaries where 70% of all volume occurred. Together, the three levels define the zone of accepted value and give the session a structural skeleton that raw candlestick charts don't provide.
Price above the Value Area High means traders are paying a premium relative to accepted value. Price below the Value Area Low means the market is trading at a discount. Neither condition is inherently bullish or bearish, but both create a gravitational pull back toward the Point of Control over time. Research by Kavajecz and Odders-White published in the Journal of Financial Markets in 2005 found that limit order clustering at specific price levels creates statistically significant support and resistance effects, which is precisely the dynamic that volume profile quantifies.
The real explanatory power lives in the distinction between high volume nodes and low volume nodes. High volume nodes are price levels where heavy trading occurred, and when price returns to an HVN, it tends to slow down because the market previously accepted that price. The residual interest from participants who traded there creates friction. Low volume nodes are the opposite: price levels the market rejected, where very little trading happened. When price enters an LVN, it tends to accelerate because there's no cluster of resting orders, no prior acceptance, and no resistance to the move.
This distinction solves a problem that confuses traders constantly. Two levels on the chart both look like "support." Price approaches both. One holds for two hours while the other breaks in thirty seconds. The chart pattern was identical, but the volume structure wasn't. The level that held sat at an HVN where the market had previously agreed on value. The level that broke sat in an LVN, rejected territory with no structural backing. According to NSE market microstructure data from 2024, the highest-volume price levels within each session see three to four times more revisitation than thin-volume levels, and the price reaction in terms of both duration and magnitude differs measurably.
What Changes When Both Layers Contradict the Chart
CVD and volume profile measure two genuinely independent dimensions of market activity. CVD reads the real-time aggression of participants. Volume profile reads the historical structure of where value was accepted and rejected. When both contradict what the price chart shows, the information compounds, because two independent data sources disagreeing with price carries more weight than either one would alone.
Consider SPY pushing above the previous session's Value Area High. On the chart, it looks like a breakout into new territory. But CVD is flat during the push, which means the move above accepted value isn't driven by aggressive buying. And the price level above the VAH sits in a low volume node from the prior week, meaning there's no historical acceptance at these prices and no friction to hold them. Price moved into a structural vacuum on passive demand. That's not a breakout. It's a probe into territory the market has already decided it doesn't value, and the participation data confirms the structural weakness.
The telling detail in this scenario is what happens to the bid-ask spread as SPY pushes into the LVN: spreads typically widen because market makers pull liquidity from prices they don't consider fair value. When you see flat CVD, thin volume structure overhead, and widening spreads all developing together, the chart pattern is already undermined before the first red candle prints.
The inverse carries equal weight. BTC pulls back to a high volume node at $67,200 on the daily chart, and CVD starts rising as price approaches the level. Aggressive buyers are stepping in at a price the market previously accepted as fair value. Two independent dimensions point the same direction: the structure says this price has history, and the flow says participants are defending it now. That's genuine confluence from unrelated data sources.
A third pattern deserves attention because it catches traders more often than outright divergence. NIFTY consolidates in a 40-point range near 22,500 for an hour and a half. The chart looks like indecision, a coiling range that could break either way. But the volume profile reveals that price is sitting directly at the session's Point of Control, which means the market is actively agreeing that this is fair value. Meanwhile, CVD is slowly and steadily climbing through the consolidation. Aggressive buyers are accumulating at accepted value while nothing happens on the price chart. When the range finally breaks, it breaks upward, and the move sustains because both the structural acceptance and the hidden accumulation supported the direction. Traders who saw only the chart pattern had a coin flip. Traders who saw the flow building inside the structure had a directional lean before the breakout candle formed.
Reading Flow and Structure Before Every Entry
Before any trade, two questions change the quality of the decision: is the participation behind this move aggressive or passive, and is price at a level the market previously accepted or rejected? Answering both takes seconds when the data is synthesised, and it introduces independent confirmation that standard charting doesn't provide.
Next time a pullback to a demand zone looks clean on the 5-minute chart, check whether CVD confirms it. A demand zone where CVD shows aggressive buyers stepping in is a different trade from a demand zone where CVD is declining through the test. The chart pattern is identical in both cases, but the participation beneath it isn't, and the probability of the level holding changes accordingly.
Volume profile adds the second filter. Is your entry level sitting at a high volume node where the market previously agreed on value, or a low volume node where price was rejected? Buying at an HVN with rising CVD means two independent signals support the level. Buying at an LVN with flat CVD means you're trading a chart pattern with no structural or flow backing underneath it. That distinction matters before you commit capital.
These questions don't replace an existing process. They layer on top of it. A trader who already reads price structure and momentum indicators gains two additional dimensions that operate independently from anything on the standard chart. Draconic, an AI trading intelligence platform, synthesises 176+ proprietary metrics in real time, surfacing the relationship between flow, value structure, and price in one view rather than requiring separate tools for each layer.
Here's what that synthesis looks like for a NIFTY session where price is testing 22,450. Draconic shows the Point of Control sitting at 22,430, meaning accepted value is just below current price. CVD has been rising through the test, indicating aggressive buying at this level. The Value Area Low at 22,380 marks the boundary below which the market would be trading at a discount to session value. Three data points, one view, and a decision grounded in both flow and structure rather than chart pattern alone.
That NIFTY rally from the opening looked strong because the only layer visible was price. Underneath, participation was passive and the move had carried price beyond accepted value into thin territory. Both signals were available before the chart confirmed the reversal.
More like this
July 4, 2026ai-trading
Chartink Alternative: Draconic vs Chartink
The Draconic Team • 6 min
July 4, 2026ai-trading
Sensibull Alternative: Draconic vs Sensibull
The Draconic Team • 6 min
May 12, 2026behind-the-price
Sector Rotation — The Macro Signal Most Traders Ignore
The Draconic Team • 3 min
May 11, 2026behind-the-price
How Market Makers Create Invisible Floors and Ceilings
The Draconic Team • 11 min