Why "Support and Resistance" Is an Incomplete Framework
What actually makes a support level hold?
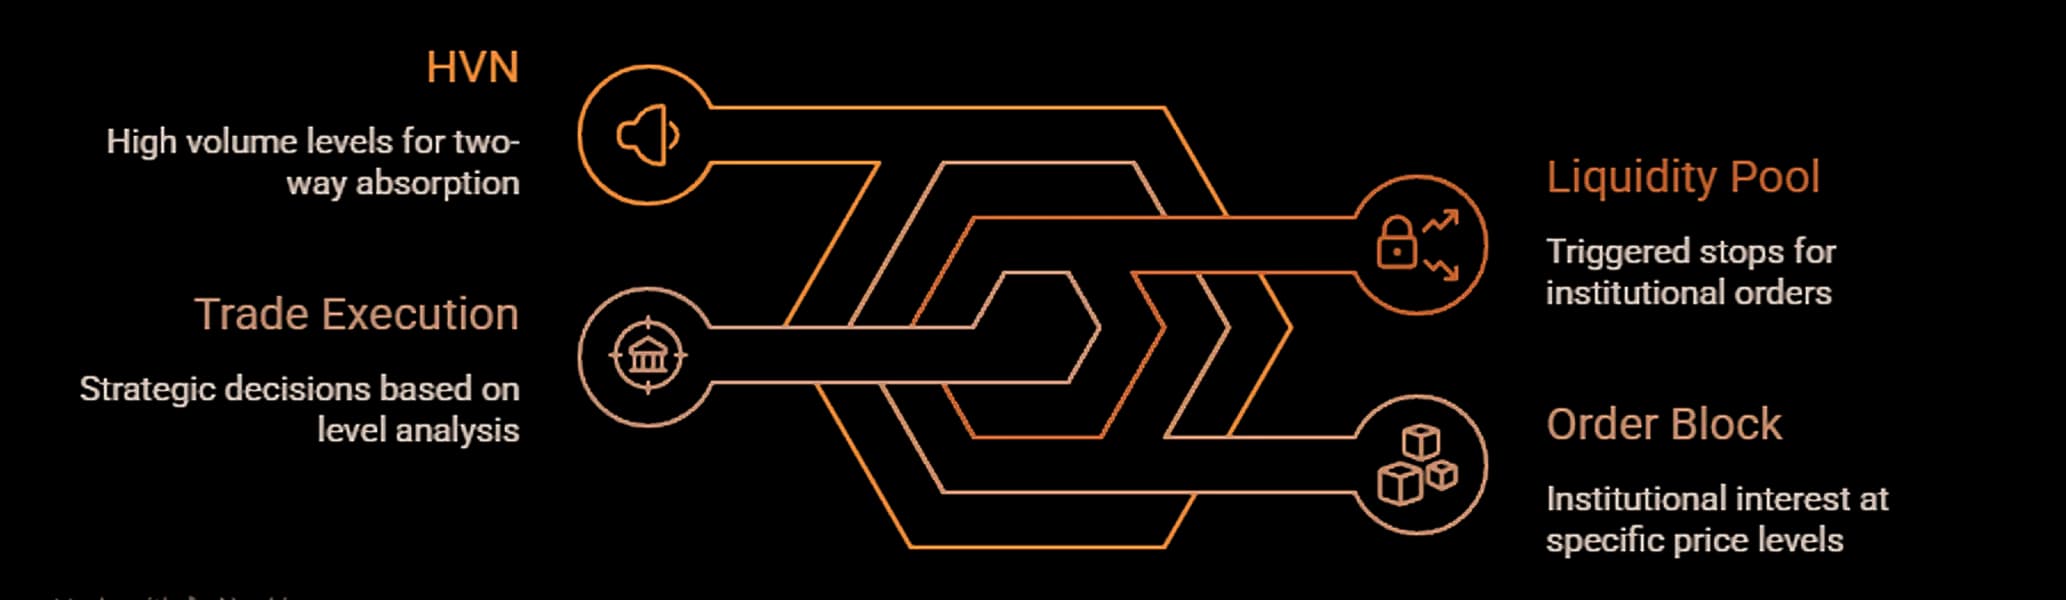
Support holds because of structure beneath it, not because price bounced there twice. Three mechanics create reaction zones: high volume nodes (Market Profile zones of prior agreement, where price slows into friction and chop), order blocks (untested institutional positioning that produces a sharp impulsive reaction but degrades with each test), and liquidity pools (clusters of stops that act as targets, not floors; price sweeps through, fills institutional orders, then reverses). Each demands different stop placement and time horizon. The line summarises where price reacted; it doesn't explain why or whether the force is still there.
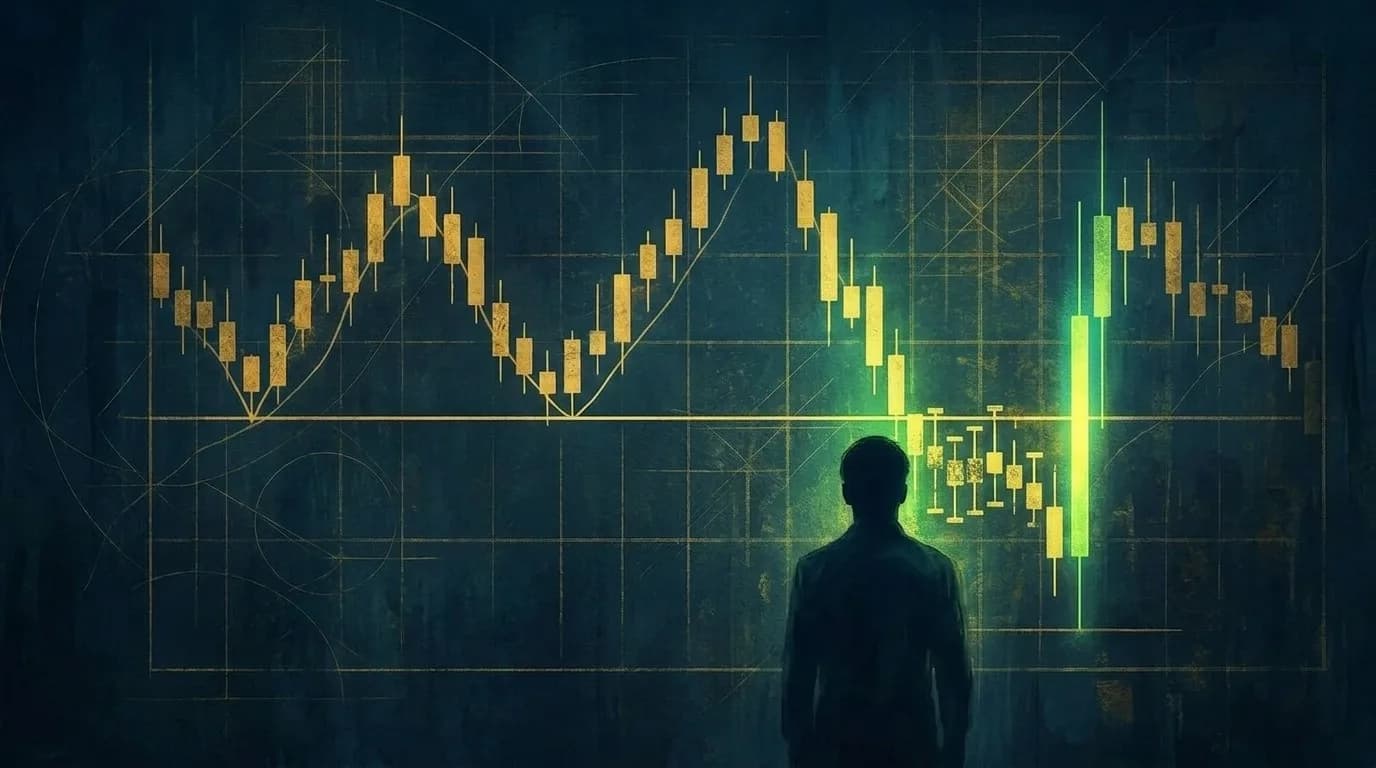
You draw a support line at a level where price bounced twice. Clean touches, solid reactions, textbook. You set your buy order just above it and wait for the third test.
Price arrives. Pierces straight through. Your stop triggers. Then, forty minutes later, price reverses from a level thirty points lower that had no visible significance on the chart.
The line you drew wasn't wrong. It was incomplete. You were tracking where price reacted without understanding what makes a support level actually hold, and the level where it actually reversed had a different mechanic at work beneath it.
What Actually Makes Support Levels Hold
Support levels hold when a structural force is present beneath them, not because price bounced there before. Three independent mechanics create genuine reaction zones: high volume nodes from auction theory, order blocks from institutional positioning, and liquidity pools from clustered stop orders. Each behaves differently when price returns, and conflating them is why traders misjudge which levels hold.
The traditional approach draws a horizontal line wherever price previously reversed. Two bounces and it's "confirmed." But that framing treats all reactions as identical, which they aren't. A level where the market spent hours transacting behaves fundamentally differently from a level where institutional orders are resting, which behaves differently still from a level where retail stop-losses are clustered. The mechanic behind the level determines its character: whether it acts as friction, a springboard, or a trap.
Research from J. Peter Steidlmayer, who developed Market Profile theory at the Chicago Board of Trade in the 1980s, first formalised the distinction between price levels where volume concentrates and those where volume is absent. His insight was foundational. Markets are auctions, and the distribution of volume across prices reveals where participants agreed on value and where they rejected it. Standard support and resistance analysis ignores this distinction entirely.
Volume Concentration — Where the Market Already Agreed on Value
A high volume node (HVN) is a price level where significant trading volume accumulated over a session or period, indicating that both buyers and sellers found the price acceptable enough to transact heavily. When price revisits an HVN, it encounters friction because the level represents a zone of prior agreement, and participants who traded there before have positions to defend.
The friction at an HVN is different from a sharp bounce. Price doesn't snap away from the level like a rubber band. It slows down, chops, and often spends considerable time there before resolving in either direction. NIFTY spends disproportionate session time at levels corresponding to the previous session's Point of Control, the single price where the most volume traded. This concentration effect is consistent across sessions because institutional participants anchor to these levels for execution benchmarks.
When NIFTY trades through a low volume node, an area where the market previously rejected price and moved through quickly, the transition is fast and often violent. When it enters a high volume node, the move stalls. This distinction explains a common frustration: a trader enters on a breakout, watches price cut through several levels cleanly, then watches it stall and chop at one particular zone for twenty minutes. That zone is likely an HVN. The breakout wasn't failing. It was encountering a different type of level, one that absorbs momentum rather than deflecting it.
The practical implication is straightforward. An HVN acts like sand, not a wall. Price moves through it slowly, with significant two-way action. A trader expecting a sharp bounce at an HVN will get frustrated by the chop. A trader expecting slow absorption and range rotation will manage the position better, with wider stops and a longer time horizon than the same setup at an order block.
Order Blocks — Where Institutions Left Unfinished Business
An order block is the last opposing candle before an impulsive price move, marking the approximate zone where large institutional orders drove price away from a level. When price returns to an untested order block, those institutional interests often re-emerge because the original position hasn't been fully exited or because similar participants view the level as valuable again.
The identification is mechanical, not interpretive. A bullish order block is the last bearish candle before a sharp rally. A bearish order block is the last bullish candle before a sharp selloff. NSE trade data consistently shows elevated average order sizes at these zones compared to surrounding price action, which confirms the institutional participation that the visual pattern implies. You can see the same signature on SPY around earnings gaps and on RELIANCE around quarterly result reactions.
What makes order blocks distinct from simple support is the quality of the reaction. When price returns to a genuine untested order block, the response tends to be impulsive: a sharp rejection rather than the slow friction an HVN creates. This is because the institutional orders sitting at the level are typically limit orders waiting to be filled, and when price reaches them, execution happens quickly and directionally.
An important caveat that most Smart Money Concepts content glosses over: order blocks degrade with each test. Large participants rarely place their entire position at a single level. They scale in across a zone, and each time price returns and fills part of the resting order, less remains. The first retest of an untested order block carries the highest probability of reaction. By the third or fourth test, the block is largely mitigated, and traders who trust it are relying on a depleted zone. This is the same pattern traders observe with traditional "support": each test weakens the level. The difference is that order block theory explains why.
Liquidity Pools — Where Your Stop Becomes Someone Else's Entry
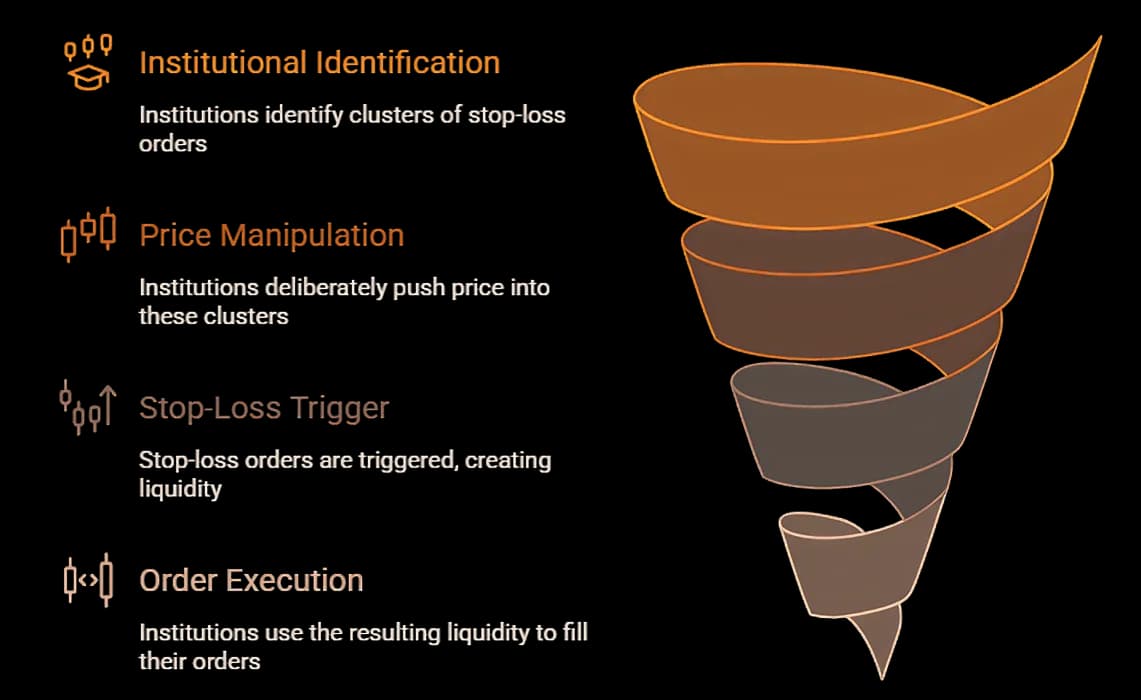
Liquidity pools are clusters of stop-loss orders sitting at predictable price levels (typically just beyond recent swing highs and swing lows), and institutional participants deliberately push price into these clusters to trigger the stops and use the resulting liquidity to fill their own large orders. The level isn't support or resistance. It's a target.
This is the mechanic that makes traders feel like the market is watching them personally. You place a stop two points below the swing low. Price sweeps through, triggers it, and reverses within minutes. According to the SEC's 2020 Market Structure Report on institutional execution strategies, large participants routinely seek liquidity at predictable levels because they can't fill their full positions at a single price without moving the market against themselves. Stop clusters provide exactly the volume they need.
The pattern is consistent across markets and timeframes. In BTC, unswept sell-side liquidity below a range low attracts probing moves during low-volume hours. In NIFTY, stops clustered below visible swing lows get swept before weekly expiry positioning resolves. The underlying logic doesn't change: stops represent resting orders, resting orders represent available liquidity, and institutional participants need that liquidity to execute at scale. SEBI's 2023 derivatives study found that retail F&O traders disproportionately cluster stop-losses at round numbers and obvious swing points, which concentrates the available liquidity even further and makes the sweep more attractive.
This is where the traditional support and resistance framework fails most completely. A trader who draws support at the swing low and places a stop just beneath it is, from the institutional perspective, adding to the liquidity pool that makes the sweep worthwhile. The level isn't supporting price. It's attracting price. Understanding the difference is the distinction between being the liquidity provider and being the one who uses it.
How the Mechanic Changes What You Do at the Level
Knowing that a level exists isn't actionable by itself. Knowing what created it is. The practical shift comes from asking one question before trading any level: is this zone defended by volume concentration, institutional positioning, or clustered stops? The answer changes stop placement, sizing, and how long you expect the trade to take.
At an HVN, expect slow, choppy price action. Tight stops will get whipsawed repeatedly because the zone is designed for two-way absorption, not directional resolution. A trader working a mean-reversion setup at an HVN needs wider stops and patience that would be misplaced at other level types.
At an untested order block, expect a sharper reaction if the thesis is correct. The level is binary: either the institutional interest is still there or it's been absorbed. If price spends significant time at the block without an impulsive reaction, the block is likely mitigated and continuing to hold the position is hoping rather than trading. One test. Sharp reaction or move on.
At a liquidity pool, the expectation inverts entirely. Price arriving at the pool isn't a buying opportunity. It's the first half of a two-part sequence: the sweep, then the reversal. The trade isn't at the level itself but after the level gets taken, once the sweep completes and price begins to reverse with flow confirmation. Placing a stop below a liquidity pool is adding fuel to the sweep. Waiting for the sweep to complete is trading with the mechanic rather than against it.
Draconic, an AI trading intelligence platform, synthesises across all three mechanics simultaneously. Instead of guessing which type of level you're approaching, a single question returns the structural breakdown: whether the zone is an HVN with deep volume history, an untested order block with institutional footprints, or an unswept liquidity pool with clustered stops.
The Level Was Never Just a Line
That support line you drew identified where price reacted. It couldn't tell you why, or whether the same force would be present next time price arrived. A line on a chart is a summary of the past. The mechanic behind it is a statement about what might still be there, and understanding which mechanic you're facing changes everything from where you place your stop to how long you hold the position.
The next time price approaches a level on your chart, the question isn't whether it bounced there before. It's whether volume accepted value at that zone, whether institutional orders created it, or whether it's a cluster of stops waiting to be swept. The answer shapes the trade.
See what's actually defending the levels on your chart — explore Draconic.
More like this
July 4, 2026ai-trading
Chartink Alternative: Draconic vs Chartink
The Draconic Team • 6 min
July 4, 2026ai-trading
Sensibull Alternative: Draconic vs Sensibull
The Draconic Team • 6 min
May 12, 2026behind-the-price
Sector Rotation — The Macro Signal Most Traders Ignore
The Draconic Team • 3 min
May 11, 2026behind-the-price
How Market Makers Create Invisible Floors and Ceilings
The Draconic Team • 11 min