Who Actually Moves the Price?
Who actually moves the price in markets?
Three participant types create every move, each with a distinct footprint. Market makers don't trade directionally — they make the spread and hedge continuously, leaving mechanical buying and selling around gamma exposure levels. Institutions trade directionally in size, and the size is the problem: a 50,000 lot order can't fill at one price, so it leaves order blocks, fair value gaps, and deliberate liquidity sweeps. Retail behavior is the most predictable — stops cluster just below obvious swing lows, entries cluster at round numbers. A bounce at "support" looks identical regardless of which participant defended it, but the follow-through is completely different.
When you click buy, someone clicks sell. That much every trader knows. What most traders don't think about is who that someone is, and why it matters far more than the price at which the transaction happens.
The market isn't a faceless mechanism. It's a structure built from the behaviour of three distinct participant types, each with different motivations, different constraints, and different footprints in the price chart. Reading a chart without knowing who's on the other side of each move is like reading a conversation without knowing who's speaking.
Three Participants, Three Signatures
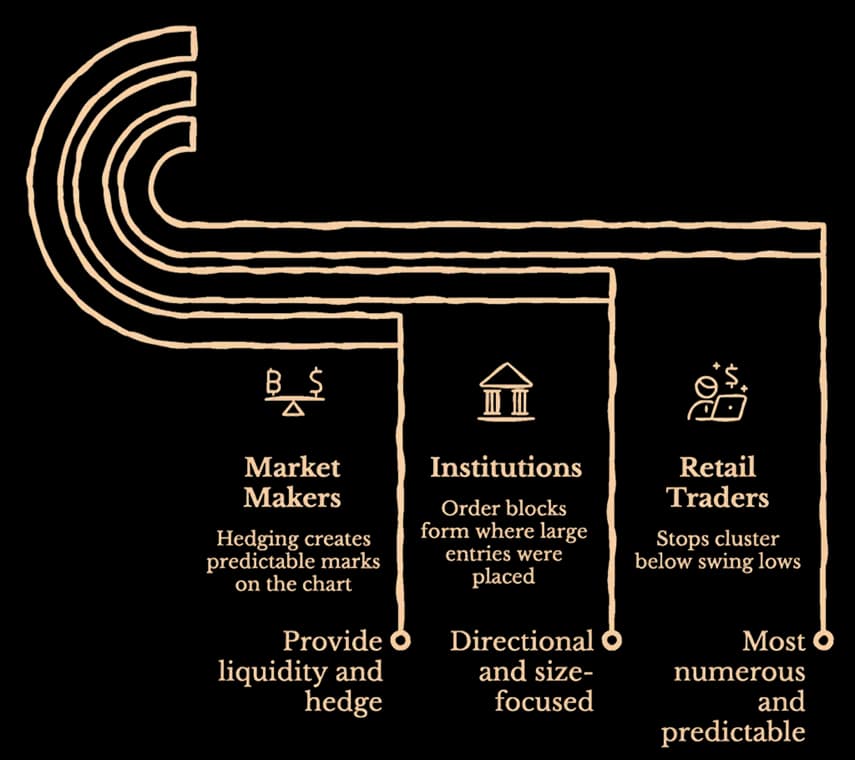
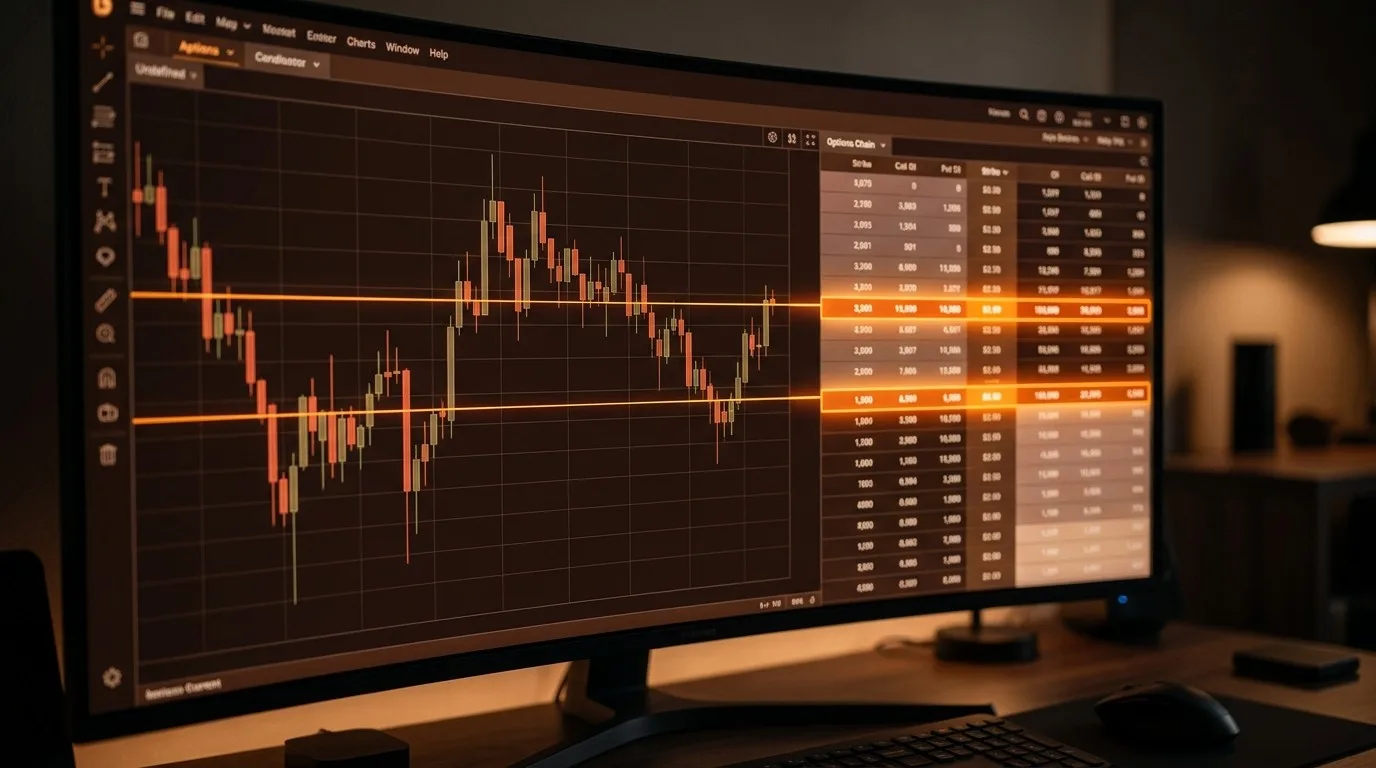
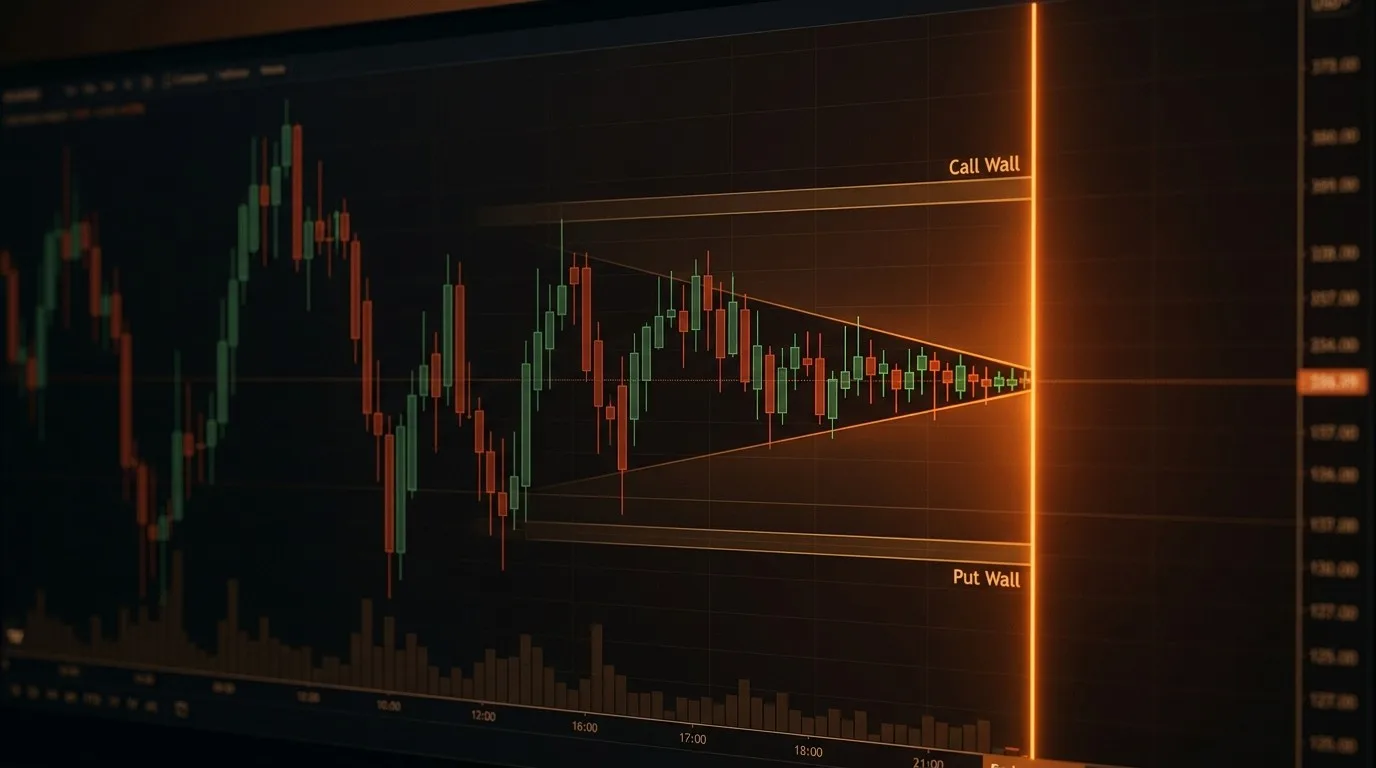
- Market makers exist to provide liquidity. When you buy, they often sell to you. When you sell, they often buy from you. Their business model isn't directional conviction — it's the spread. They make money by being on both sides of transactions, and they hedge their resulting exposure continuously to stay approximately delta-neutral. This hedging creates mechanical, non-directional buying and selling that leaves predictable marks on the chart. When the market maker's hedge requires buying they buy regardless of direction, and when it requires selling they sell. The gamma exposure levels discussed in later articles in this series are essentially a map of where that hedging activity concentrates, and therefore where it creates invisible floors and ceilings that have nothing to do with technical support or resistance.
- Institutions are directional. Banks, funds, and large prop desks are trying to get long or short in size, and size is the problem. A 50,000 lot position can't be filled in one trade without moving the market against itself. So institutions work their orders across time, across price levels, and often in ways designed to disguise their intent. They create the footprints that Smart Money Concepts attempts to read: the order blocks that form where large entries were placed, the fair value gaps that appear when price moved too fast for the market to fill cleanly, the liquidity sweeps that happen when institutions push price to a stop cluster specifically to generate the flow they need to fill. These footprints are visible in hindsight and increasingly readable in real time with the right data, but they require knowing what to look for.
- Retail traders are the most numerous and the most predictable. SEBI's FY25 study found 91% of individual F&O traders lost money — net losses of ₹1.06 lakh crore in a single year — which is what being the predictable side of the trade looks like in the data. Not because individual retail traders are unsophisticated, but because retail behaviour in aggregate is structurally consistent. Stops cluster just below obvious swing lows and just above obvious swing highs, because those are the levels retail traders are taught to use. Entries cluster at round numbers and at visually obvious breakout levels. This predictability isn't a flaw in the retail trader's process — it's a feature of the market structure that institutions have learned to exploit. The stop cluster below a swing low is something more than a technical level: a known pool of liquidity that a large participant needs to sweep in order to fill a position cleanly.
Why This Changes How You Read a Chart
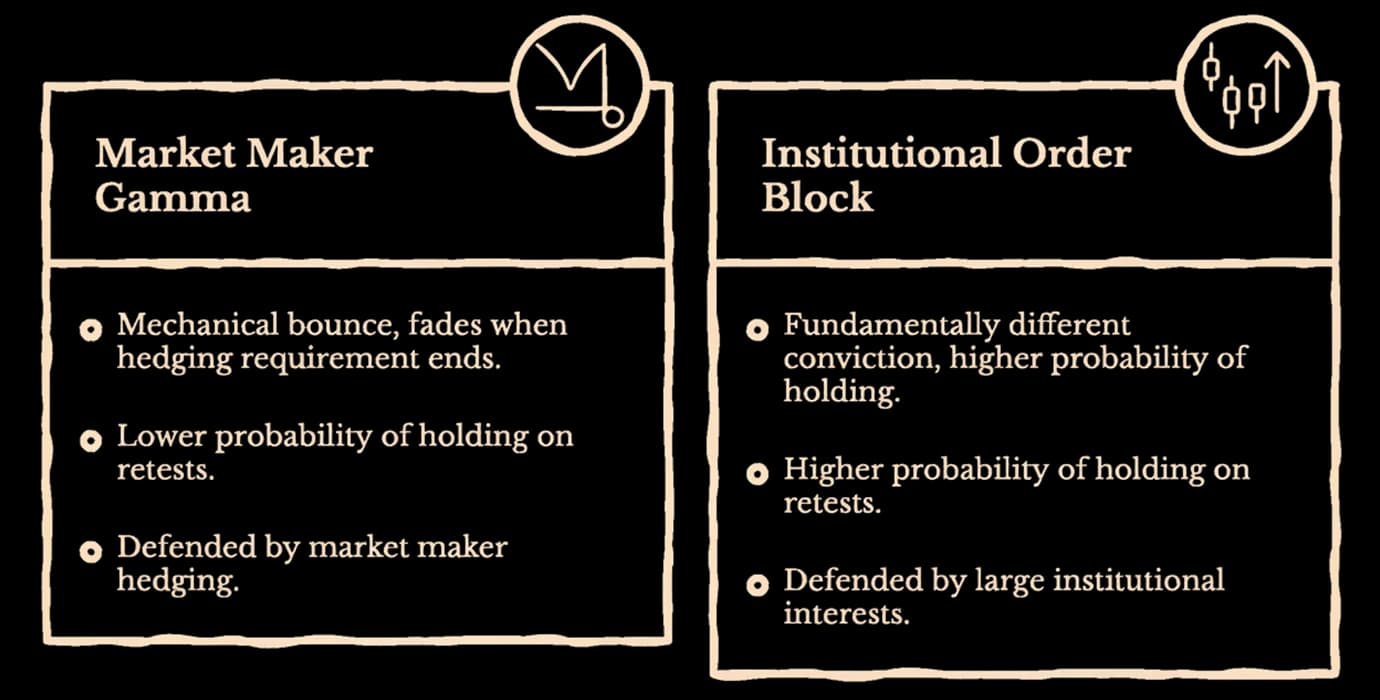
A price bounce at a support level looks the same regardless of which participant caused it, but the follow-through is completely different depending on who defended it.
A bounce off a market maker gamma level is mechanical and will last only as long as the hedging requirement exists, fading when it doesn't. A bounce off an institutional order block means large interests re-entered at that level, so the conviction behind the move is fundamentally different, and so is the probability of it holding on retests. A bounce off a level that's simply a round number with retail stops below it is the weakest of the three, with no structural participant defending it, just the mechanical reaction of triggered orders.
Most traders draw a line and call it support, but the participant framework asks a different question: whose support is this? The answer changes the trade.
Reading Participants in Real Time
The practical skill isn't memorising which participant does what. It's building the habit of asking, before any trade, whose behaviour is most likely driving the current move and whether that participant's motivation supports continuation or reversal.
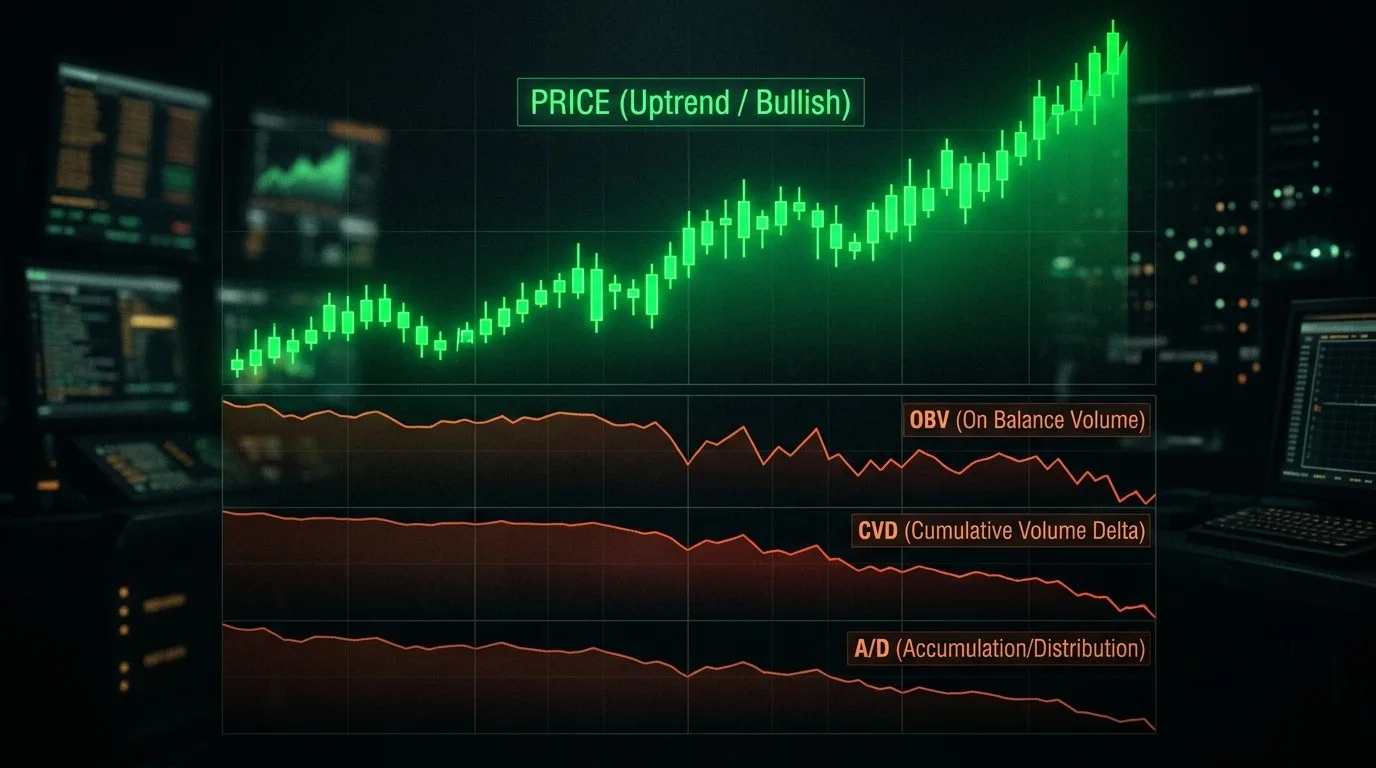
A breakout on high volume that leaves an unmitigated fair value gap is almost certainly institutional. A slow grind toward a round number on declining volume is almost certainly retail-stop accumulation. A sharp reversal at a level with no prior structural significance is often a market maker hedge adjustment that looks, on the chart, like a technical reaction.
None of these reads are perfect, but each one is better than treating all price reactions as equal, which is what happens when you look at a chart without asking who's behind each move.
Draconic, an AI trading intelligence platform, surfaces participant-level intelligence in real time, tracking institutional footprints through order blocks and fair value gaps, identifying stop clusters through liquidity pool detection, and mapping market maker behaviour through gamma exposure levels.
The chart doesn't tell you who moved the price, but once you start asking that question, every level you see reads differently.
More like this
May 12, 2026behind-the-price
Sector Rotation — The Macro Signal Most Traders Ignore
The Draconic Team • 3 min
May 11, 2026behind-the-price
How Market Makers Create Invisible Floors and Ceilings
The Draconic Team • 11 min
May 8, 2026behind-the-price
The Magnetic Levels — Why Price Gets Drawn to Certain Numbers Near Expiry
The Draconic Team • 8 min
May 7, 2026behind-the-price
When Three Flow Signals Agree Against Price
The Draconic Team • 4 min