
Mapping today's gamma landscape before you trade
The Problem
Gamma exposure trading is the practice of reading the options market's mechanical forces before you look at a single chart. Most traders skip it entirely, and the result is a persistent confusion: some days, NIFTY bounces perfectly off round numbers and stays in a 100-point range. Other days, it blows through those same levels like they aren't there. The chart looks identical. The indicators give similar readings. But the behavior is completely different.
You check your trendlines, your moving averages, your RSI. Nothing explains why a level that held yesterday collapsed today. So you chalk it up to "the market being random" and move on. But it isn't random. There is a mechanical reason, and it has nothing to do with what's on your chart.
The reason lives in the options market. Specifically, in how options market makers hedge their positions. Their hedging creates invisible forces that either dampen or amplify price moves at every level on your screen. Whether those forces are working with you or against you changes everything about how your day unfolds.
KEY INSIGHT
Options market makers hedge by buying and selling the underlying. In positive gamma, this hedging dampens moves: market makers buy dips and sell rallies, creating range-bound behavior. In negative gamma, hedging amplifies moves: market makers sell into declines and buy into rallies, creating trending conditions. The gamma flip level is the boundary between these two regimes. Knowing which regime you're in before market open changes how you trade every level on the chart.
What Changes With Synthesis
The traditional approach to gamma is either to ignore it entirely or to treat it as a single data point. A trader might check a GEX chart, note "positive gamma today," and move on without connecting that reading to the specific levels they plan to trade. The gamma number sits in one tab. The chart sits in another. The connection between them happens in the trader's head, if it happens at all.
The harder problem is that gamma doesn't exist in isolation. A positive gamma regime with the flip level 50 points below current price is a different situation from positive gamma with the flip level 5 points below. The first means price is comfortably inside a dampened zone. The second means one bad candle transitions the market into amplification mode. That distinction requires holding the gamma regime, the flip level, the put and call walls, and the current price in your head simultaneously.
With multi-dimensional synthesis, the question becomes direct: "What's today's gamma regime, where's the flip level, and how does that interact with the key levels I'm watching?" The answer integrates positioning data with price structure in one view, so the mechanical context arrives alongside the levels it affects.
The Method
How to map your gamma exposure before trading
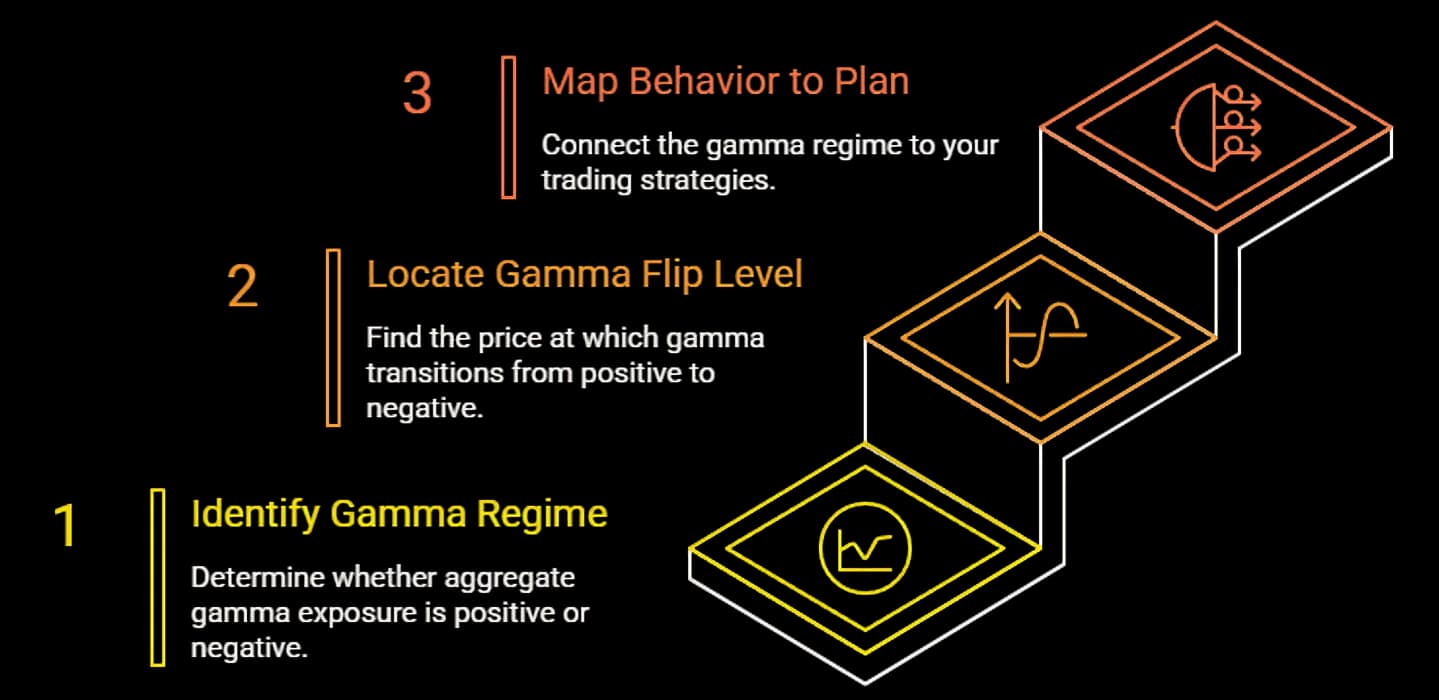
Step 1: Identify the gamma regime (2 minutes)
Check whether aggregate gamma exposure is positive or negative for today's session. Positive GEX means market makers are long gamma: their hedging creates a stabilizing force that buys dips and sells rallies. Negative GEX means they're short gamma: their hedging amplifies directional moves. Compare today's reading to the 30-day average to gauge intensity. A mildly positive reading near the average is background noise. A reading at twice the average, positive or negative, is the dominant force for the session.
Step 2: Locate the gamma flip level (2 minutes)
Find the price at which aggregate gamma transitions from positive to negative. This level is the most important price on the chart that doesn't appear on any chart. Above the flip in positive gamma territory, expect dampened moves and mean-reversion. Below the flip in negative gamma territory, expect amplified moves and trending behavior. The distance between current price and the flip level tells you how much room exists before the regime changes. A 200-point cushion is comfortable. A 30-point cushion means the session could transition regimes on a single impulse move.
Step 3: Map the expected behavior onto your trading plan (3 minutes)
Connect the gamma regime to what you intend to trade. In positive gamma, mean-reversion strategies at put and call walls have mechanical support. Breakout strategies face headwinds because market maker hedging sells rallies and buys dips, compressing range. In negative gamma, the opposite holds: breakout strategies have mechanical tailwinds because hedging amplifies directional moves, while mean-reversion at levels is fighting the amplification.
This step also requires knowing where the put wall and call wall sit. In positive gamma, price tends to oscillate between these walls. In negative gamma, price tends to breach them and extend. If your plan is to buy a dip at the put wall, that trade has strong mechanical backing in positive gamma and almost none in negative gamma.
In Practice
Two Thursdays. Same index, same levels, same chart patterns. Different outcomes.
Day 1. NIFTY opens at 23,280. Aggregate GEX is positive, roughly 1.5 times the 30-day average. The gamma flip level sits at 23,050, well below current price. The put wall is at 23,200 with heavy OI concentration. The call wall is at 23,400.
During the session, price dips to 23,210 and bounces sharply. It rallies to 23,380 and stalls. Dips again to 23,225, bounces again. The range holds for five hours. A chart-only trader sees "strong support at 23,200." What's actually happening: market makers are long gamma. Every dip toward 23,200 triggers their hedging models to buy the underlying, creating mechanical support. Every rally toward 23,400 triggers selling. The range isn't holding because of a trendline. It's holding because of hedging flows.
Day 2. NIFTY opens at 23,280 again. GEX is negative, about 0.6 times the 30-day average. The gamma flip level sits at 23,300, just 20 points above the open. The same put wall at 23,200 still has high OI.
Price dips to 23,210. This time, no bounce. Market makers are short gamma, so their hedging sells into the decline. Price slices through 23,200, triggering stops clustered below the level, which generates more selling, which the market maker hedging amplifies further. NIFTY drops 150 points in 40 minutes. A chart-only trader sees "support failed." What actually happened: the gamma regime was amplifying moves instead of dampening them. The same level, with the same OI, behaved in the opposite way because the mechanical forces were reversed.
The difference between these days was invisible on any price chart. It was entirely visible in the gamma landscape — which Draconic's free NIFTY gamma exposure tool maps for you each session: the walls, the flip, and the regime.
Common Mistakes
- Treating gamma as a directional signal Positive gamma does not mean bullish. It means dampened. Price can grind lower all day in a positive gamma regime; it just does so slowly, in a controlled range, without the explosive breaks that catch traders off guard. Negative gamma does not mean bearish. It means amplified. A rally in negative gamma can extend far beyond what indicators suggest, precisely because market maker hedging is buying into the rally instead of selling it.
- Ignoring intraday regime shifts. The gamma flip level is not static. As options are traded throughout the day, aggregate gamma changes. A session that opens in positive gamma can transition to negative gamma if large put positions are opened or if price moves close to the flip level. Checking gamma once at the open and assuming it holds all day misses these transitions.
- Applying GEX analysis to illiquid instruments. Gamma exposure analysis is most reliable for liquid index options where market maker hedging represents a significant portion of underlying volume. For individual stock options with thin OI, hedging flows are too small relative to total volume to create the mechanical effects described here. NIFTY, BankNifty, SPX: reliable. A mid-cap stock with 500 contracts of OI: not meaningful.
FAQs
GEX requires aggregating gamma across all strikes and expiries from the options chain, then netting the exposure. Some platforms calculate and publish it. A multi-dimensional synthesis tool can surface the regime, flip level, and key strike concentrations together in a single query.
Less reliably. GEX is most meaningful for liquid index options (NIFTY, BankNifty, SPX) where market maker hedging is a large percentage of total underlying volume. For stocks with thin options OI, the hedging flows are too small to create consistent mechanical effects.
Behavior transitions. Above the flip in positive gamma, moves are dampened and price tends to revert. Below the flip in negative gamma, moves are amplified and price tends to extend. The flip level itself is a zone of instability where the market can oscillate between regimes, producing choppy, unpredictable price action.
The put wall (highest put OI) and call wall (highest call OI) are static positioning levels. Gamma determines how price behaves near those levels. In positive gamma, price tends to bounce between the walls. In negative gamma, price tends to breach them and extend. Same walls, different physics.
Yes. Large options trades, particularly near the flip level, can shift aggregate gamma. If price crosses the flip level, the regime transitions and behavior changes. Monitoring gamma once at the open is a good start, but active traders should check for shifts at midday and after any large options prints.
Relevant
See today's gamma regime and flip level
This guide is for informational and educational purposes only. It does not constitute financial advice. Trading involves risk. Draconic provides market intelligence; all trading decisions are your own.