The Death of the Dashboard
Why does trading dashboard overload hurt decisions?
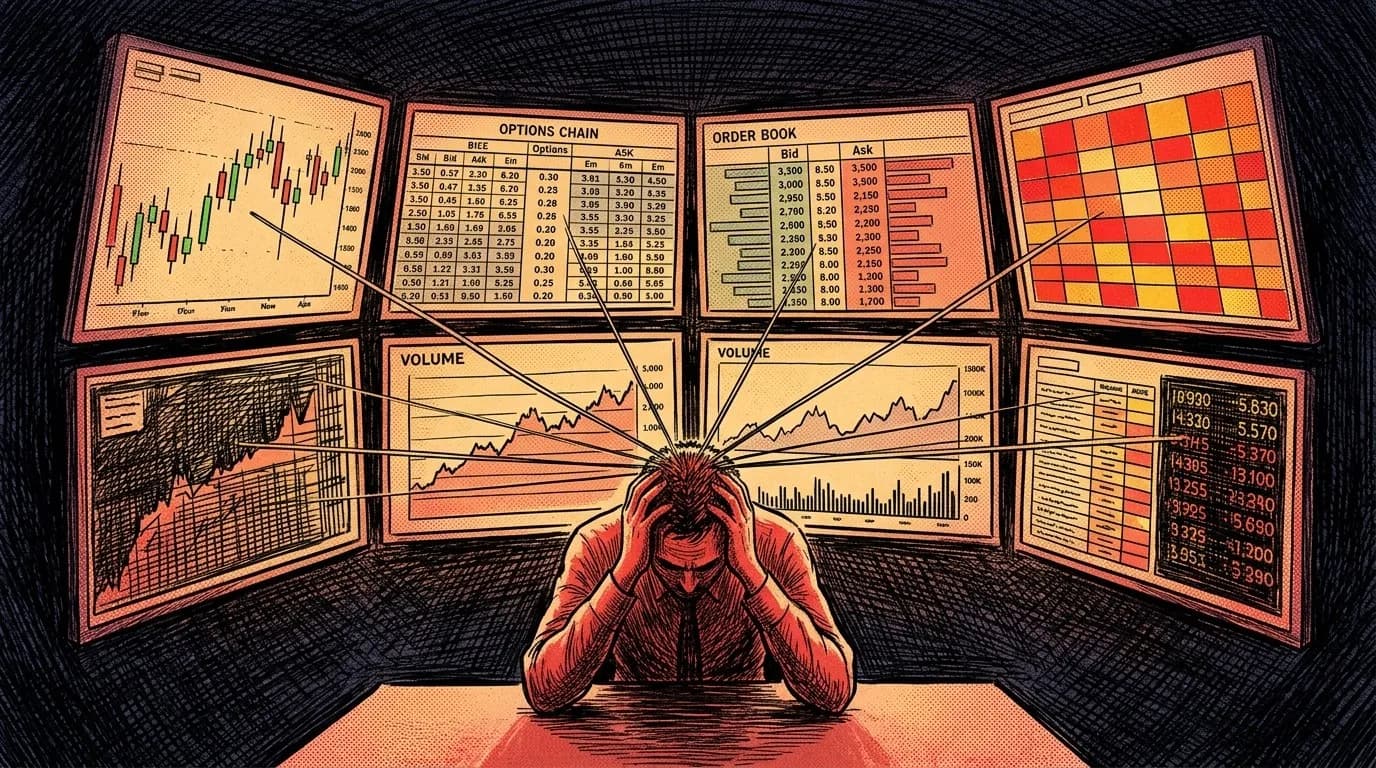
The standard trading workspace asks human working memory to synthesize eight or more panels (options chain, chart, order book, flow, Greeks) under time pressure. Miller's research caps working memory at roughly seven items; Sweller's cognitive load theory shows interface synthesis competes with the actual trade decision for the same processing budget. Adding an AI chatbot as a ninth panel doesn't fix it. A synthesis-first interface replaces panel-scanning with a single query: the computer integrates everything, the trader evaluates the answer.
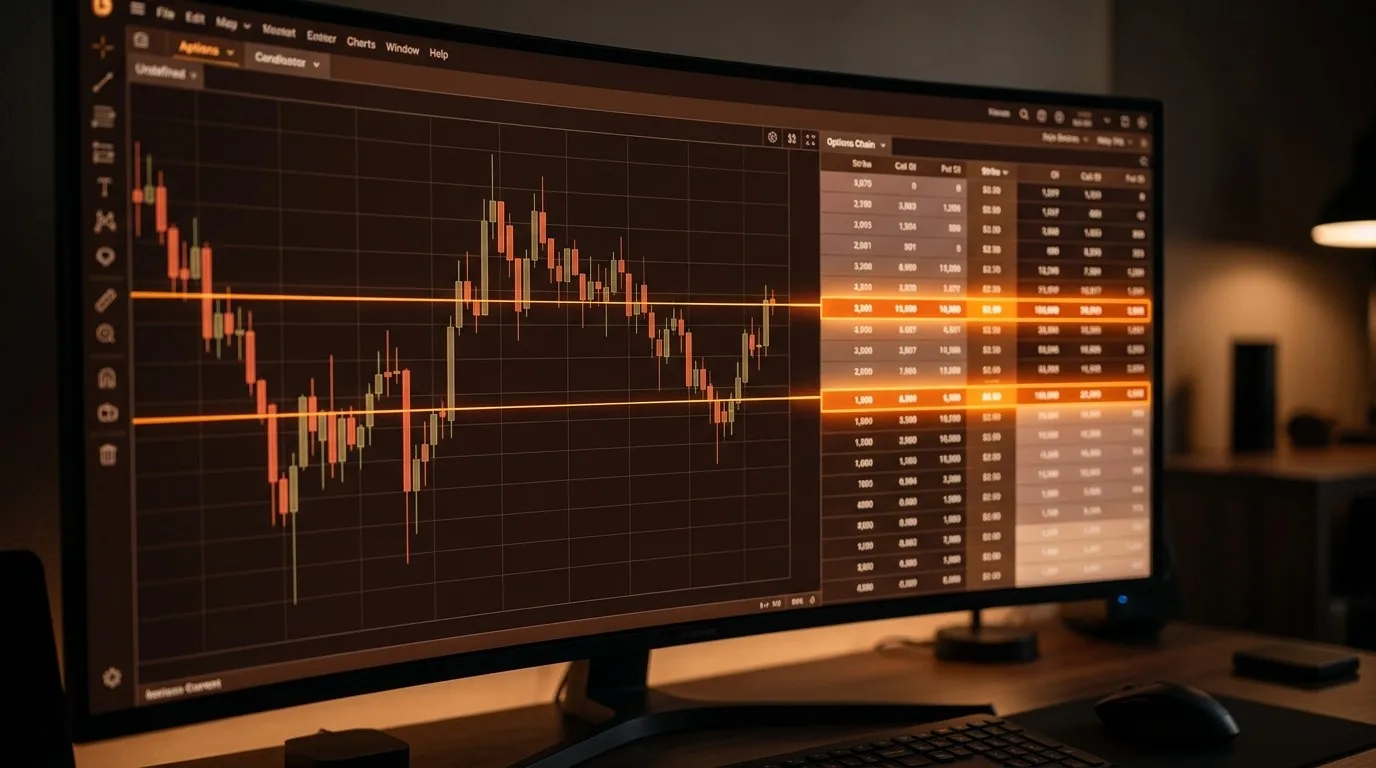
Open your broker platform and count the panels. Options chain, chart, order book, positions, news feed, watchlist, Greeks, flow data. That's eight sources of information on a single screen, and this trading dashboard overload is the default state of every serious trader's workspace. Each panel shows something useful. None of them talk to each other.
Every connection between those panels happens inside your head: what the options chain reveals, what the order book signals, what the volume profile suggests. You're the one synthesizing it all, under time pressure, while the market moves.
This arrangement has been the standard for two decades, and it feels normal. But it's the end point of an assumption nobody has seriously challenged: show the trader more data, and they'll make better decisions. That assumption is wrong, and the future of trading UI isn't about adding more panels.
Why Dashboard Overload Hasn't Produced Better Traders
The dashboard paradigm assumes the human brain is the best available tool for synthesizing multi-dimensional market data in real time. That assumption held when there was no alternative. It doesn't hold anymore, because the cognitive architecture required to scan eight panels and integrate their implications exceeds what human working memory can reliably process under time pressure.
George Miller's 1956 research at Princeton, published as "The Magical Number Seven, Plus or Minus Two" in Psychological Review, established that human working memory holds roughly seven discrete items simultaneously. The finding has survived six decades of replication. A trader scanning eight panels isn't processing eight independent data streams in parallel. They're holding three or four, dropping information from earlier panels to make room for new input, and reconstructing context every time their attention shifts to a different window.
John Sweller's Cognitive Load Theory, developed at the University of New South Wales and published in Cognitive Science in 1988, explains why this matters in practice. When the interface forces the user to perform the integration work (connecting price action to options positioning to order flow to structural levels), the resulting load is "extraneous." It doesn't contribute to decision quality. It competes with the actual decision for the same limited processing capacity. The trader isn't just analyzing the market. They're simultaneously managing the interface, and both tasks draw from the same cognitive budget.
The industry response has been to add more. Every major broker is in an arms race to expand what's visible on screen, building configurable multi-panel layouts with more tabs, more widgets, and more data feeds. Each addition is a genuine improvement in data access. None of them address the synthesis problem, because that problem lives in the human brain, not the interface.
SEBI's 2023 study, "Analysis of Profit and Loss of Individual Traders dealing in Equity F&O Segment," found that 89% of individual F&O traders in India lost money over a three-year period. The study cited behavioral factors and information asymmetry as primary causes. What no study has yet examined is whether the interface contributes to that asymmetry. When the platform demands cognitive synthesis that most humans can't sustain at speed, the disadvantage isn't purely informational. It's architectural.
The Retrofitting Trap: AI Bolted Onto the Wrong Paradigm
Adding an AI chatbot panel alongside existing dashboard elements doesn't solve the synthesis problem; it adds a ninth panel. The fundamental issue isn't that traders lack an AI-powered widget. It's that the dashboard interaction model forces human visual scanning as the primary synthesis method, and bolting a conversational tool onto a scanning-based interface changes nothing about the underlying cognitive demand.
Every major broker is doing exactly this. A chatbot tab appears beside the chart. An AI summary widget sits next to the options chain. The interface was designed for human visual scanning across panels, and the AI becomes one more element to scan rather than a replacement for scanning itself. The question traders should ask when evaluating these tools isn't whether the AI is good. It's whether the AI has the structural freedom to do what it's actually supposed to do.
This is the retrofitting trap. The AI shouldn't be another panel competing for the trader's finite attention. It should replace the need for most panels by performing the synthesis those panels were asking the human to do. That's the difference between a UI improvement and a paradigm change. Putting a navigation app on a car dashboard is an improvement. Removing the need to navigate at all is a different category of change entirely.
What Replaces the Multi-Panel Workflow
A synthesis-first interface replaces multi-panel visual scanning with a single interaction: the trader asks a question, and the system synthesizes across all relevant data sources to produce an integrated answer. The human's role shifts from scanning and mentally connecting panels under time pressure to evaluating a synthesized picture and deciding what to do with it.
Instead of opening six tabs to build a pre-market picture, you ask one question: "What should I be watching in NIFTY today?" Instead of switching between chart timeframes, the options chain, and a CVD panel to evaluate a pullback, you describe what you see and ask what you might be missing. The synthesis happens computationally, across dimensions that no human could hold in working memory simultaneously, and the answer arrives in seconds rather than minutes.
This isn't a theoretical future. Conversational interfaces that synthesize across multiple data sources already exist. The question is whether the trading industry adopts this interaction model or keeps bolting conversational features onto dashboard architectures designed before computational synthesis was possible. The trajectory follows the same path that has already reshaped adjacent workflows, and the shift applies equally whether you trade on NSE, the NYSE, or a crypto exchange.
Three Minutes of Scanning Versus Ten Seconds of Synthesis
The practical gap between dashboard scanning and synthesis-first interaction isn't the quality of data available to the trader. It's the cognitive load required to reach a decision. A trader scanning six panels for three minutes and a trader reading one synthesized answer in ten seconds are working from the same information through fundamentally different processing architectures.
Consider what happens in the seconds before entering a trade. A NIFTY options trader sees a pullback to a demand zone on the five-minute chart. In the dashboard model, they check the higher timeframe for trend context, flip to the options chain for OI concentration at nearby strikes, look at CVD for aggressive flow direction, glance at the volume profile for value area position, and scan India VIX for the volatility regime. Five panels, three to five minutes, and a mental model assembled from sequentially scanned fragments.
In the synthesis model, the same trader asks one question: "NIFTY is pulling back to 23,400 on the five-minute. What am I missing?" The answer integrates velocity context, OI positioning, flow direction, structural analysis, and higher timeframe alignment into one response. Same information, same market, same decision to make. The difference is where the cognitive work happens and how long it takes.
Draconic, an AI trading intelligence platform, is built around this synthesis-first model. Rather than presenting panels for the trader to scan, Draconic synthesizes across 176+ metrics in real time, spanning price dynamics, institutional flow, options positioning, market depth, and multi-timeframe structure, and delivers the integrated picture as a single conversational response to whatever the trader asks.
The difference isn't that one trader has access to better data. It's that one is spending cognitive capacity on synthesis while the other spends it on the decision. When the interface handles the integration, the trader's full attention goes where it actually creates value: evaluating the picture, weighing the risk, and choosing whether to act.
Eight panels on a screen isn't a sign of a sophisticated setup. It's a sign that the interface is asking you to do work a machine can do faster and more completely. The dashboard paradigm was the right answer to a previous era's question: "How do we show traders more data?" The question that matters now is different: "How do we show traders what the data means?" That question has an answer, and it doesn't look like a dashboard.
More like this
July 4, 2026ai-trading
Chartink Alternative: Draconic vs Chartink
The Draconic Team • 6 min
July 4, 2026ai-trading
Sensibull Alternative: Draconic vs Sensibull
The Draconic Team • 6 min
May 12, 2026behind-the-price
Sector Rotation — The Macro Signal Most Traders Ignore
The Draconic Team • 3 min
May 11, 2026behind-the-price
How Market Makers Create Invisible Floors and Ceilings
The Draconic Team • 11 min