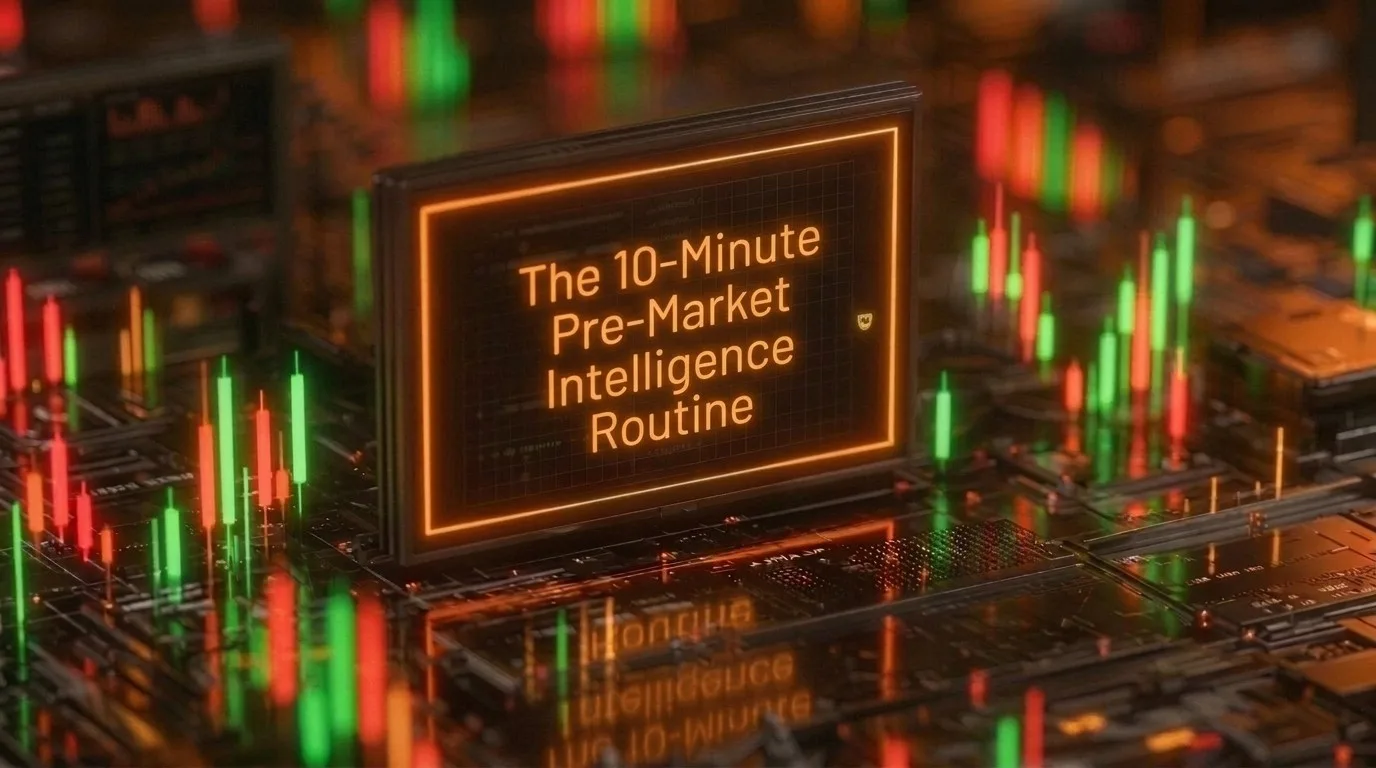
The 10-Minute Pre-Market Intelligence Routine
The Problem
It's 8:47 AM. Market opens in thirteen minutes. The pre-market routine is already behind schedule. TradingView is running on one screen, the NSE option chain occupies a browser tab, a news feed scrolls on another, and yesterday's journal sits half-open beside the keyboard. Each source shows a slice of what today might look like. None of them talk to each other.
The routine goes something like this: check overnight price action, glance at the option chain for OI concentration, scan the news for anything that moved markets in the US or Asia overnight, flip to a sector heatmap, then try to stitch it all together mentally before the opening candle prints. By the time every tab has been visited, the market is already moving and the "preparation" phase has become a reactive scramble.
The problem isn't laziness or a lack of discipline. It's structural. Pre-market preparation requires synthesizing five different data dimensions, but the tools traders use were designed to display one dimension at a time. The synthesis has to happen inside the trader's head, under time pressure, with no reliable way to hold all five dimensions simultaneously.
KEY INSIGHT
A complete pre-market picture requires five dimensions checked in sequence: overnight positioning shifts, gamma regime assessment, volume profile context from the prior session, sector rotation signals, and a synthesis that connects them. With AI-native analysis, this takes ten minutes. Manually, it takes forty-five, and the mental synthesis degrades the moment you move from one tab to the next.
What Changes With Synthesis
The traditional pre-market routine is a product of the dashboard era. Open five tools. Scan each one independently. Try to hold the findings in working memory while checking the next source. By the time you reach the fifth dimension, the first has already started to fade.
The specific failure point is the mental merge. A trader might notice that overnight OI shifted heavily toward puts at the 22,500 strike. Good information. Then they check the volume profile and see a low-volume node just below 22,480. Also useful. But connecting these two facts, recognizing that the OI shift and the structural gap are reinforcing each other to create a high-probability zone, requires holding both in mind simultaneously while also factoring in gamma regime, sector context, and the prior session's positioning. That's five dimensions competing for the same working memory. Research on cognitive load suggests most people can hold three to four independent variables before accuracy drops (Cowan, 2001). Pre-market synthesis demands more than that.
AI-native preparation replaces the tab-cycling workflow with a question: "What should I focus on for NIFTY today?" The response draws from all five dimensions simultaneously, surfacing the interactions between them rather than presenting each in isolation. The trader still decides what to do with the context. But the context itself arrives pre-synthesized, with the cross-dimensional connections already identified.
What follows is the five-step routine. Each step takes roughly two minutes. The order matters: each step's output informs how you interpret the next.
The Method
The pre-market intelligence method
Step 1: Overnight positioning check (2 minutes)
Check net OI change from yesterday's close at each major strike. Where did OI increase significantly, indicating new positions opening? Where did it decrease, indicating positions closing? Has max pain shifted from yesterday's level?
This tells you where institutional money moved while you were offline. A significant overnight shift in put OI concentration from 22,400 down to 22,200 means the floor the market was defending yesterday may no longer exist at the same level today. Your prior support and resistance levels may not reflect today's positioning reality. This step resets the map before you look at price.
Step 2: Gamma regime assessment (2 minutes)
Determine whether today's aggregate GEX is positive or negative, and locate the gamma flip level. Compare today's reading to the 30-day average to gauge whether the current regime is typical or unusual.
This sets the rules of engagement for the entire session. In positive gamma, market makers' hedging dampens price moves: they buy dips and sell rallies, creating range-bound conditions where mean-reversion strategies thrive. In negative gamma, hedging amplifies moves: market makers sell into declines and buy into rallies, creating trending conditions where breakout strategies work and mean-reversion gets punished. Knowing the regime before the opening candle prints tells you which playbook applies today. Trading a mean-reversion approach in negative gamma is fighting the mechanical forces that drive the session.
Step 3: Volume profile context (2 minutes)
Identify the prior session's Point of Control, Value Area High, and Value Area Low. Locate any low-volume nodes between yesterday's close and today's expected open, particularly if the market is gapping.
Volume profile defines the mechanical support and resistance landscape. High-volume nodes are prices where the market previously accepted value. Price tends to slow through them, making them natural areas for entries or profit targets. Low-volume nodes are prices the market rejected. When revisited, price moves through them quickly, often catching traders off guard. If today's expected open sits above a low-volume node, the gap between the open and the nearest high-volume node below becomes a fast-travel zone with little structural support. That changes how aggressively you position early in the session.
Step 4: Sector rotation scan (2 minutes)
Check which sectors are leading and lagging relative to the broad market in pre-market activity. Look for divergences: is money flowing out of one sector and into another? Is the index being carried by a narrow group of large-cap names, or is participation broad?
Sector context prevents a common mistake: trading an individual stock against its sector's momentum. A bullish chart on a banking stock matters less if the entire banking sector is underperforming while capital rotates into IT. Sector rotation also signals macro shifts. When defensive sectors lead and cyclicals lag, the market is pricing in risk reduction regardless of what the index level shows. This step takes your focus beyond the single instrument and places it in the broader flow of capital.
Step 5: Synthesis question (2 minutes)
This is where the five dimensions collapse into a single picture. The question: given overnight OI shifts, the gamma regime, volume profile structure, and sector positioning, what are the key levels and scenarios for today?
If you've been running the first four steps manually, this is the step where mental synthesis either succeeds or breaks down. You're trying to connect OI concentration at specific strikes with gamma regime implications, overlay that onto volume profile structure, and factor in sector rotation, all while the clock ticks toward market open.
With AI-native synthesis, this step is a single query. The output identifies which levels have multi-dimensional significance (a strike with heavy OI concentration sitting at a volume profile node, in a gamma regime that reinforces it), which scenarios are mechanically likely given the positioning, and where the key decision points sit for the session. The trader reads the synthesis, forms a bias, identifies the levels to watch, and opens the session with a structured view rather than a scattered one.
In Practice
Thursday morning. NIFTY expiry day. The market closed Wednesday at 22,480.
Step 1 reveals that overnight OI shifted significantly. Put writers added heavy positions at the 22,400 strike, while call writers concentrated at 22,600. Max pain sits at 22,500, unchanged from Wednesday. The positioning suggests the options market expects price to stay in the 22,400 to 22,600 corridor through expiry.
Step 2 shows the gamma regime is positive above 22,450 and flips to negative below it. This means that as long as price stays above 22,450, market maker hedging will dampen moves and support range-bound behavior. If price breaks below 22,450, the regime flips and moves accelerate. The flip level sits just 30 points below current price. That's close enough to matter.
Step 3 identifies Wednesday's Point of Control at 22,490 and a low-volume node between 22,440 and 22,460. If price dips into that zone, there's no structural support until the high-volume node at 22,400. Combined with the gamma flip at 22,450, the zone between 22,440 and 22,460 becomes the session's danger zone: a structural gap reinforced by a regime transition.
Step 4 shows banking stocks lagging the broader index in pre-market activity, with capital rotating into IT. Since BankNifty has significant weight in NIFTY, banking weakness creates a headwind for the index even if other sectors are stable.
Step 5 synthesizes: the session's most likely scenario is range-bound behavior between 22,450 and 22,550, with max pain at 22,500 acting as a gravitational center on expiry day. The risk scenario is a break below 22,450, where the gamma flip and the low-volume node create conditions for a fast move toward 22,400. Banking weakness increases the probability of the downside scenario.
None of these connections are visible from any single data source. The option chain shows OI. The volume profile shows structural levels. The gamma calculation shows the regime. But the interaction between them, the fact that the gamma flip level sits inside a low-volume node on expiry day with banking sector headwinds, only becomes visible when all five dimensions are held together.
Common Mistakes
- Skipping straight to price. The most common failure is opening a chart first and building a directional bias before checking positioning. Once a trader sees a green pre-market candle and forms a bullish lean, every subsequent data point gets filtered through that bias. Checking OI and gamma after forming a price-based opinion is confirmation seeking, not analysis. The routine starts with positioning for a reason: it builds context before the chart creates bias.
- Reading OI without the gamma regime. Heavy put OI at a strike looks like support. But whether that OI actually creates a floor depends on the gamma regime. In positive gamma, put OI at 22,400 means market makers will buy the dip there, reinforcing the level. In negative gamma, the same OI creates selling pressure as hedges unwind, accelerating the break. OI without gamma context is an incomplete read. Combining them is the minimum for a reliable pre-market picture (SEBI F&O data, 2024).
- Trading before building context. "The market is moving, I need to act." This impulse costs more money than almost any technical mistake. The first fifteen minutes of the session are dominated by overnight order flow clearing and opening auction mechanics. Entering a position before the pre-market picture is built means reacting to noise rather than trading with context. The ten-minute routine is designed to complete before the opening bell, so that the first decision of the session is informed rather than impulsive.
FAQs
Prioritize gamma regime and overnight OI. These two dimensions set the mechanical context for the session. Gamma tells you whether to expect range-bound or trending conditions. OI tells you where the key levels sit. Volume profile and sector rotation add precision, but the regime and positioning are the foundation. Two steps in four minutes beats skipping the routine entirely.
Steps 1 through 3 apply directly to US index options (SPX, SPY) and any market with liquid options chains. Step 4 adapts to US sector ETFs or crypto sector rotation. The specific instruments change, but the five-dimension framework holds across all markets with sufficient options liquidity.
Traditional checklists check each data source independently. This routine checks how the dimensions interact. The output is not five separate observations but one synthesized picture where OI concentration, volume profile structure, and gamma regime are connected into a single read.
Start with the index. Its context affects everything traded beneath it. A bullish setup on an individual stock matters less if the index sits below its gamma flip level with negative positioning. Run the full routine for the index, then check individual instruments only when you have a specific trade idea.
Relevant
See what a complete pre-market synthesis looks like
This guide is for informational and educational purposes only. It does not constitute financial advice. Trading involves risk. Draconic provides market intelligence; all trading decisions are your own.