The Second Opinion: Check Your Trade
What is the second opinion workflow before a trade?
The chart shows price; the four dimensions that explain or contradict it live elsewhere. A second opinion is a 30-second structured check across all four before you click: price dynamics (is velocity building or decelerating into the entry?), order flow (is CVD confirming aggressive buying, or are sellers just stepping back?), higher timeframe structure (does the timeframe above yours agree?), and options positioning (where is OI concentrated at nearby strikes?). Independent is the key word — each dimension measures what the others don't. Agreement across all four is genuine confluence. Conflict is what you need to know before clicking, not after.
There is a moment every trader knows. You've identified a setup. The chart looks right. The structure is there. Your finger is on the button and a voice in the back of your mind says: "But what if I'm missing something?"
Most traders resolve that voice one of two ways. They ignore it and click anyway, hoping confidence will carry the trade. Or they spiral — opening more charts, checking more indicators, cycling through sources until the setup has moved and the window has closed.
Neither is the right answer, because the hesitation is healthy. What's missing is a structured way to resolve it quickly and objectively, before the opportunity disappears. The stakes are real — SEBI's FY25 data shows 91% of individual F&O traders lose money, averaging ₹1.1 lakh in losses each, much of it from acting on a setup without a second check.
That's the second opinion. Not a second full analysis or another hour of research. Just a systematic check of the dimensions your initial read didn't cover, completed in the 30 seconds before you click.
Why the First Opinion Is Always Incomplete
The first opinion is whatever your primary read produced. For most traders, that means a chart: price structure, maybe a momentum indicator or two, a key level. It's a real read, but it's also a narrow one, because a chart shows price and only price. Everything that explains or contradicts that price is invisible.
What the chart doesn't show is whether the buyers you're counting on are actually aggressive or just passive, whether price is rising because participants are actively lifting the ask or because sellers are stepping back. It doesn't show what the options market expects to happen at that level, or whether the move you're looking at is at the 20th velocity percentile for today's session (slow, grindy, easy to reverse) or the 80th (fast, committed, harder to fade). It doesn't show whether the higher timeframe agrees with the trade or is pointed the opposite direction.
These aren't obscure data points. They're dimensions of the same market you're already looking at, they just live in different places, and connecting them manually under time pressure is where most traders cut corners. Not because they don't understand the value, but because they don't have a fast enough way to do it before the window closes.
The second opinion workflow exists to close that gap.
What the Second Opinion Actually Checks
A complete second opinion covers four independent dimensions, and independent is the key word — each one measures something the others don't, so agreement across all four is genuine confluence, not four versions of the same signal.
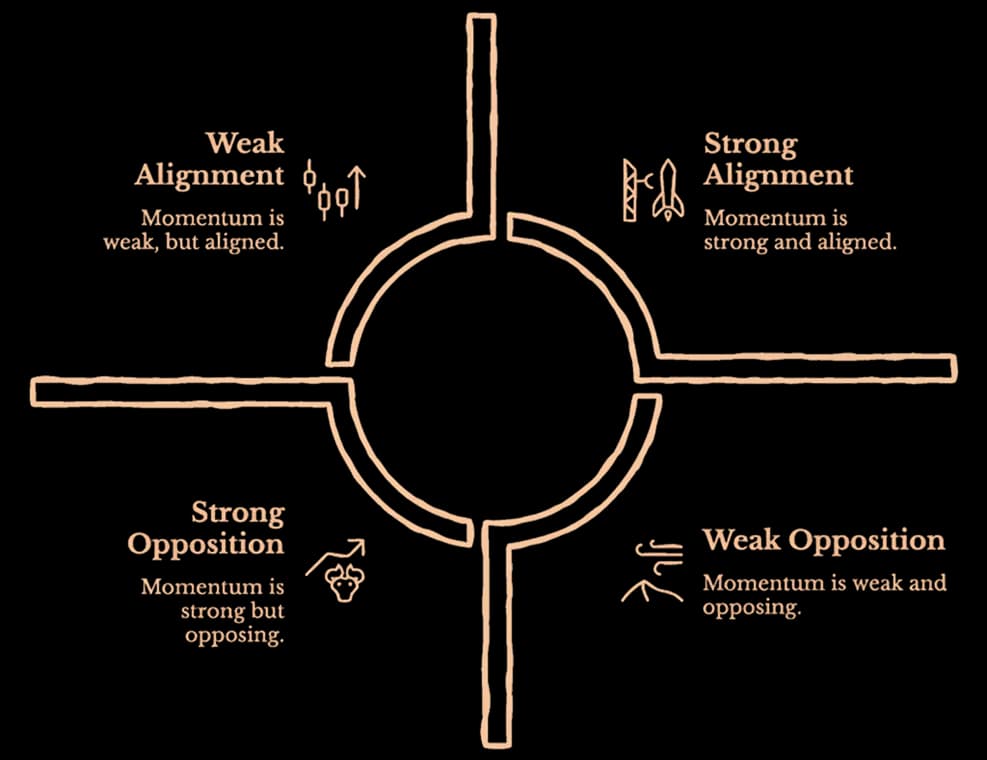
- Price dynamics. Is the move approaching your entry point exhausting or building? Velocity and swing duration tell you whether the current swing has energy behind it or is grinding into a wall. An entry into a decelerating move is an entry against momentum quality, even if the direction looks right. If velocity is already dropping while price is still making new highs, you're not buying strength, you're buying the last of it.
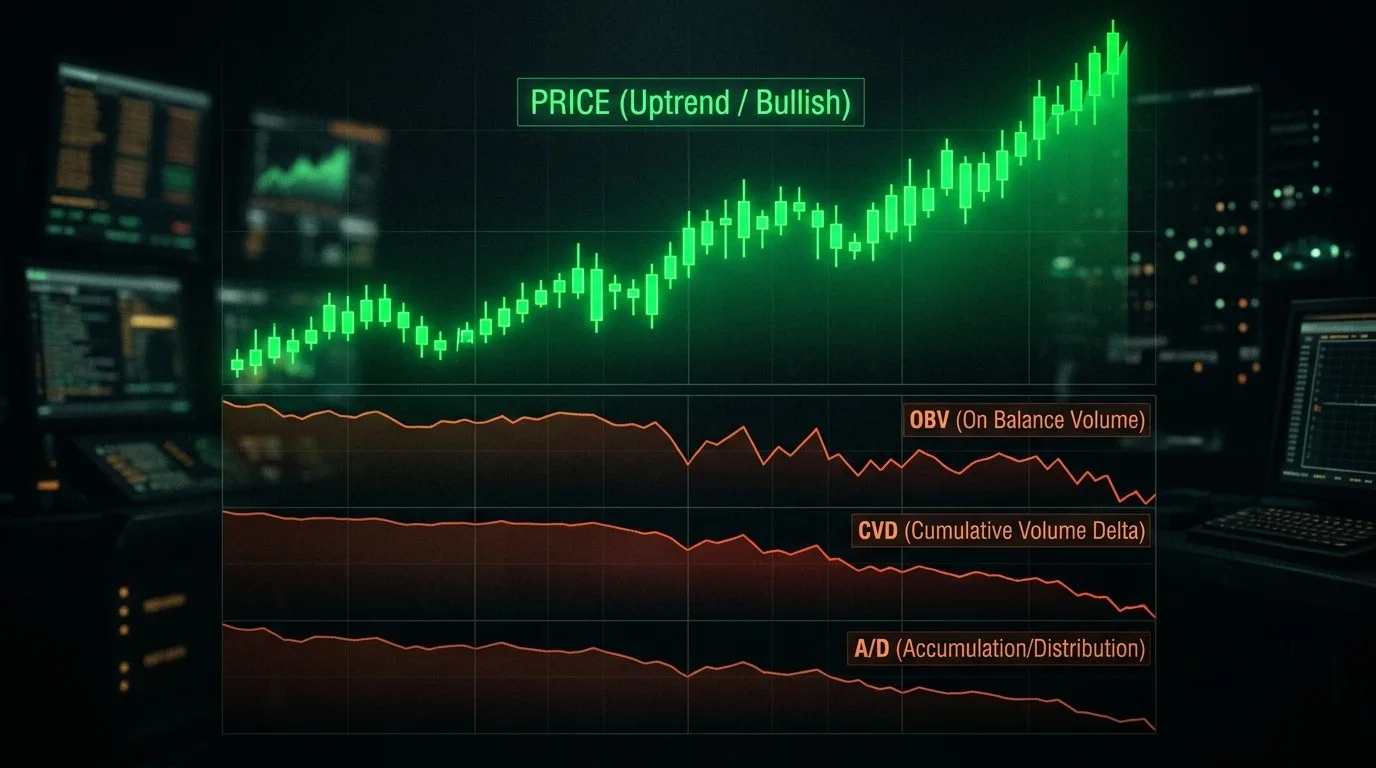
- Order flow. Is the buying actually aggressive, or is price drifting up passively? CVD tracks the net difference between aggressive buyers and aggressive sellers. A price move on positive CVD means participants are actively lifting offers, which gives the move structural backing. The same price move on flat or negative CVD means sellers are stepping back, not buyers stepping in. Those are very different trades with the same chart appearance.
- Higher timeframe structure. Does the timeframe above yours agree? A bullish setup on the 5-minute inside a bearish structure on the 15-minute isn't a trade, it's a counter-trend entry disguised as a setup. The higher timeframe is the context and the lower timeframe is the timing, so an entry without both aligned is working with half the picture.
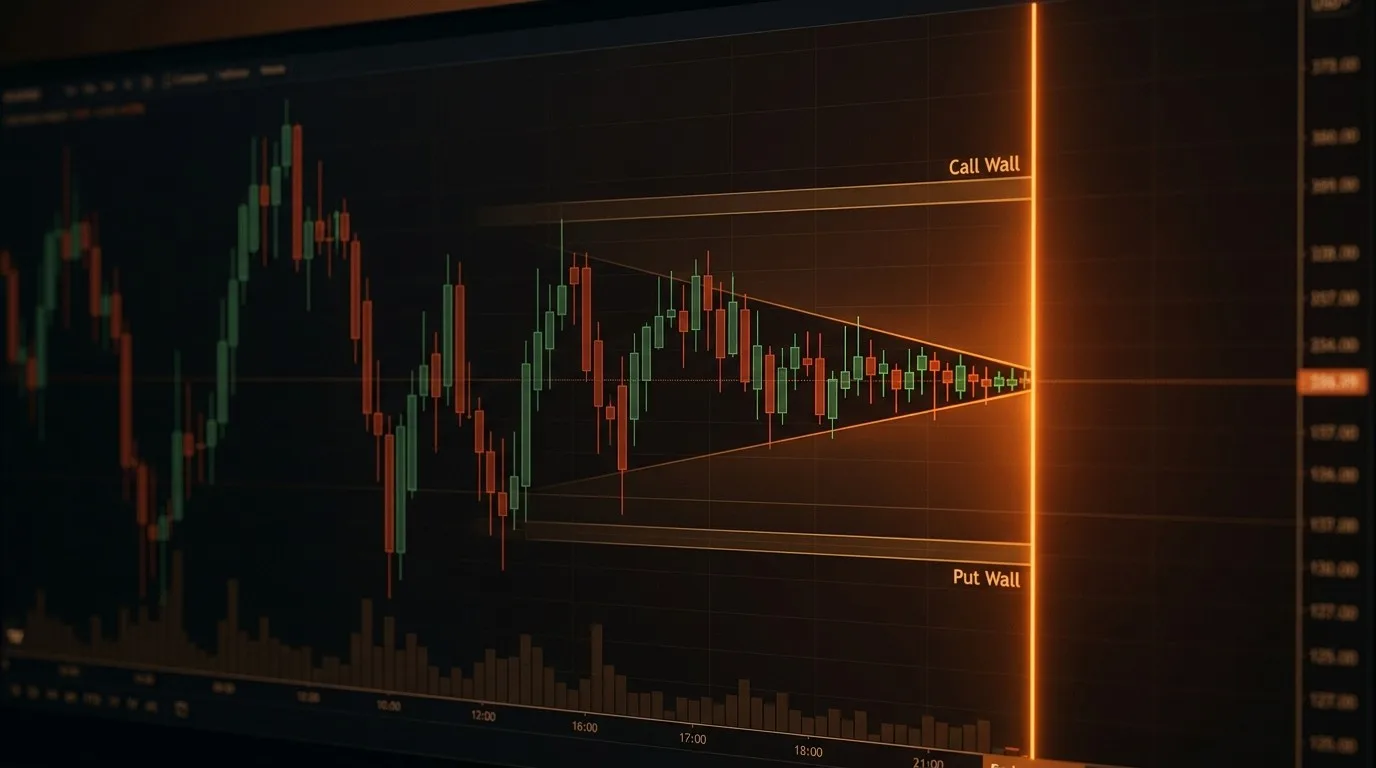
- Options positioning. Where is the open interest concentrated at nearby strikes, and does that favour or oppose the direction you're considering? High put OI at a strike below your entry acts as a floor, because dealers are delta-long below that level, which creates structural buying. High call OI above acts as a ceiling. Knowing which side of the positioning landscape you're entering from changes the probability of the trade, even if the chart looks identical either way.
None of these dimensions requires a separate app or a long analysis process. A single synthesised query produces all four simultaneously, making the check fast enough to run before every entry, not just the uncertain ones.
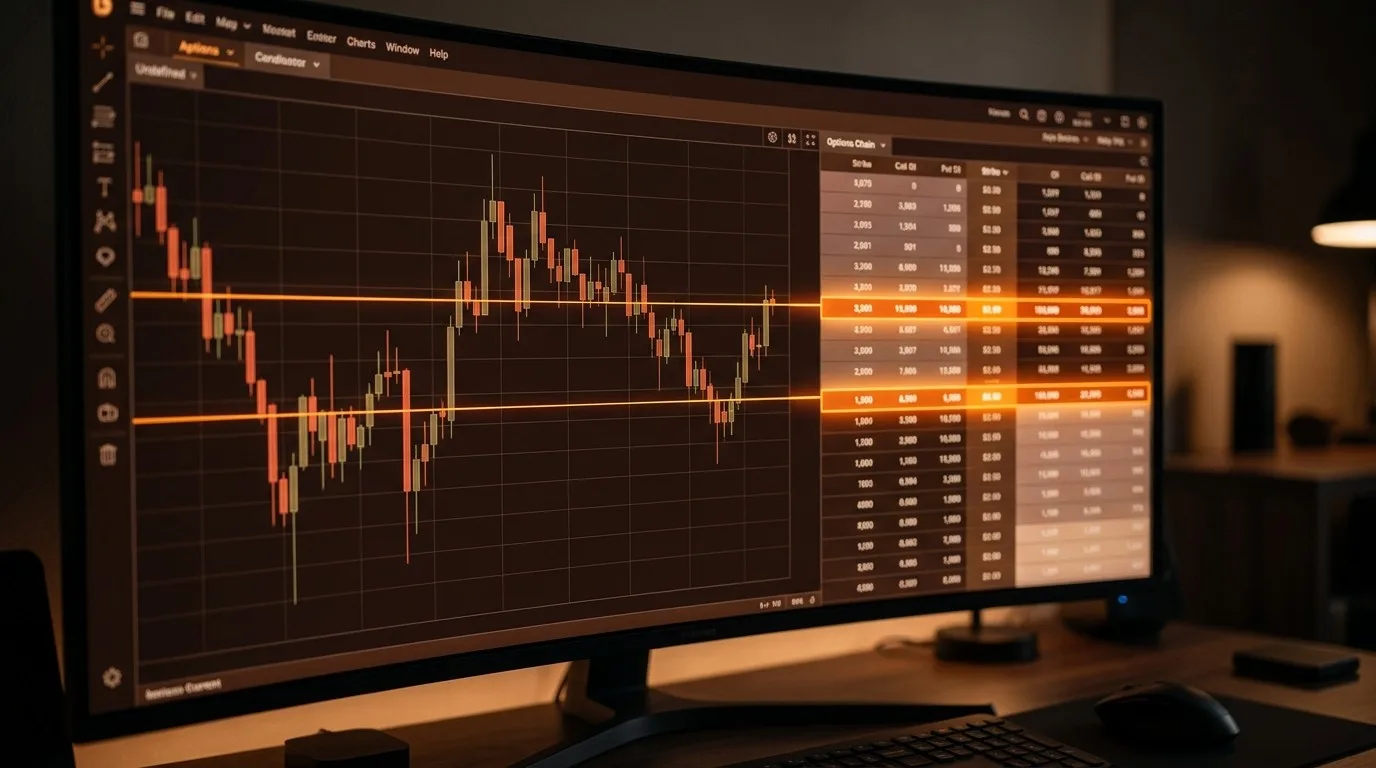
What It Looks Like in Practice
Here is an illustrative example. SPY has pulled back to a demand zone around $542 on the 5-minute chart. The prior day's low sits just below, and there's an unmitigated bullish FVG from two sessions ago sitting inside the zone. The chart looks like a textbook buy. Before clicking, the question is: "I see SPY pulling back to $542 demand. What am I missing?"
What a complete second opinion surfaces: four things the chart alone didn't show.
First, velocity on the current pullback is at the 72nd session percentile, meaning the selling pressure coming into the zone is faster than 72% of today's moves. That's not a gentle drift into support but aggressive selling arriving at a level you're planning to buy. The zone may hold, but the entry needs a reaction candle to confirm it, not a market order on arrival.
Second, CVD has been declining for the last 45 minutes while price ground sideways before the drop. The move down to $542 didn't happen on a sudden surge of selling; distribution was already happening quietly before the chart showed it. That changes what the zone is defending against.
Third, the 15-minute structure shows a lower high forming while the 5-minute still looks bullish. The trade isn't impossible, but it's a counter-trend entry on the lower timeframe, which means the stop and the target need to reflect that, not the structure-continuation sizing that a with-trend entry would justify.
Fourth, call OI is heavy at the $545 strike. Even if $542 holds and price bounces, there's a ceiling 3 points above the entry where options positioning will create resistance. The risk/reward on a long from $542 targeting $548+ is more constrained than the chart suggests.
None of that is a veto on the trade. The zone may hold perfectly, the bounce may happen, and the trade may work. But the decision to enter is now made with the full picture, not just the price chart that framed it. The sizing, the stop, and the target all adjust to reflect what the complete read actually shows. Not a veto, but a complete picture.
When the Second Opinion Changes Everything
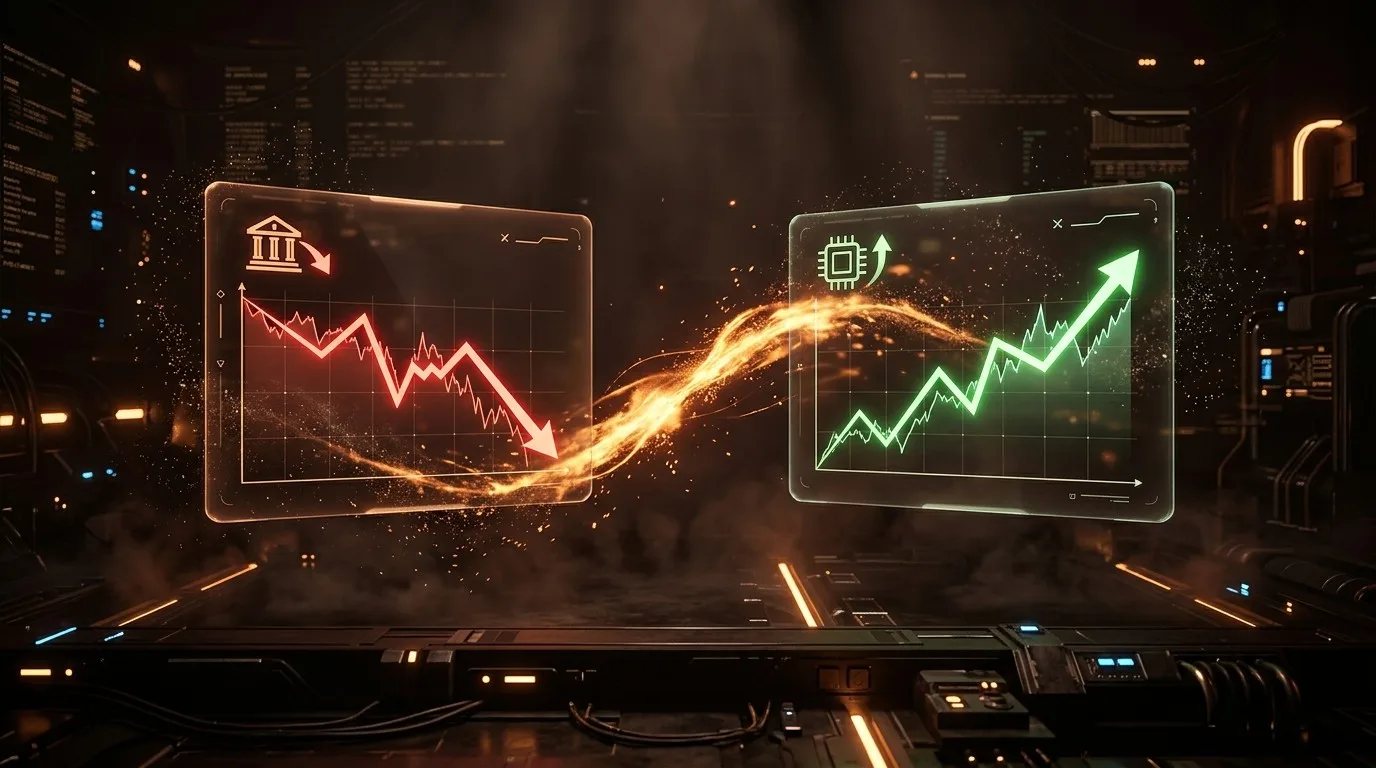
The most valuable version of the second opinion is when it surfaces a conflict that the chart doesn't show, and that conflict turns out to be the most important thing about the trade.
Price is bullish on the chart. CVD is negative. The move has been passive, sellers stepping back rather than buyers stepping in. That's a trade that looks like strength and isn't. Without the order flow check, you enter long. With it, you see a divergence that changes the entire read.
Or: structure looks bullish on the 5-minute. The 15-minute is pointed the opposite direction. The setup is a counter-trend entry that the lower timeframe framing has disguised as a trend entry. Without the higher timeframe check, the trade feels right. With it, you know exactly what risk you're taking.
These aren't hypothetical scenarios. They're the trades that look fine until they don't, and the reason they happen isn't a lack of skill or discipline. It's incomplete information resolved in the wrong direction, because there wasn't a fast enough way to check everything before the window closed.
Building It Into Every Trade
The second opinion isn't a process reserved for uncertain setups. It's most useful precisely when the setup looks cleanest, when confidence is highest and the urge to skip the check is strongest. That's when incomplete information is most dangerous, because high confidence disguises the gaps.
The practical habit is simple: before every entry, ask what you're missing. Not in a spiral of self-doubt, but as a structured check across price dynamics, order flow, higher timeframe structure, and options positioning. If they all agree, conviction increases and the entry is stronger for having been checked. If something conflicts, you know about it before you click, not after the trade moves against you.
The traders who build this habit don't make fewer trades. They make better-informed ones. And over hundreds of trades, that distinction compounds in ways that no individual entry or exit can produce.
Draconic, an AI trading intelligence platform, synthesises all four dimensions simultaneously in real time, turning a 20-minute manual cross-referencing process into a single question answered in seconds. See the second opinion workflow in practice at Draconic AI.
More like this
May 12, 2026behind-the-price
Sector Rotation — The Macro Signal Most Traders Ignore
The Draconic Team • 3 min
May 11, 2026behind-the-price
How Market Makers Create Invisible Floors and Ceilings
The Draconic Team • 11 min
May 8, 2026behind-the-price
The Magnetic Levels — Why Price Gets Drawn to Certain Numbers Near Expiry
The Draconic Team • 8 min
May 7, 2026behind-the-price
When Three Flow Signals Agree Against Price
The Draconic Team • 4 min