The Speed of Price — Direction Alone Isn't Enough
What is price velocity and why does direction alone miss it?
Direction tells you where price is going; velocity tells you whether it has the energy to get there. Velocity measures the rate of price change between swing points (not candle to candle), normalised across instruments and expressed as a session percentile calibrated to today's conditions. A reading at the 90th percentile is faster than 90% of today's swings. Three states define every move: expanding (continuation probable), stable (mature trend), decelerating (the exhaustion signature — direction intact but pace dying, which precedes structural breaks). RSI and MACD measure direction; none of them measure session-contextual speed.
You enter a trade because price is moving your way. The chart looks clean — higher highs, structure intact, momentum indicators green. Three minutes later the move stalls. Five minutes later it reverses. You exit with a small loss and spend the next hour trying to figure out what you missed.
What you missed wasn't visible on the price chart. It was in the speed of the move, and the fact that speed was already dying before price showed any sign of turning. Direction tells you where price is going, but velocity tells you whether it has the energy to get there. Those are different questions with different answers.
Direction Is Incomplete Information
Standard momentum indicators measure the same thing through different lenses, and none of them measure the one thing that actually predicts sustainability.
Every standard momentum indicator, RSI, MACD, Stochastic, answers the same question: is price moving up or down, and how strongly? They're all measuring direction. What none of them measure is the rate at which price is covering distance between swing points, and whether that rate is unusual for the current session.
That gap matters because a trend isn't just a sequence of higher highs. It's a sequence of higher highs produced by swings with enough energy to sustain themselves. When that energy is deteriorating, when each successive swing is covering the same distance in more time, the trend is spending itself even if the direction hasn't changed yet. Price can keep making higher highs on a chart while the underlying momentum is already broken, and every standard indicator will still read bullish. The velocity story is telling the opposite.
What Velocity Actually Measures
Velocity measures the rate of price change between swing points, not candle to candle but swing to swing, and that difference in calculation method is what makes it structurally distinct from every standard indicator.
A candle-based calculation averages the move across an arbitrary time period. A swing-based calculation measures the move between actual structural turning points, from the moment price starts moving in a direction to the moment it stops. It captures the genuine pace of a directional move rather than smoothing it across time periods that have no structural significance.
The formula is straightforward: price change divided by duration in minutes, normalised by the base price so readings are comparable across instruments and price levels. The result is in basis points per minute, which means a SPY move and a NIFTY move can be compared directly because the calculation strips out the price level difference. Sign tells you direction — positive velocity means an upward swing, negative means a downward swing. Magnitude tells you pace, so a reading of +12.0 means price is covering a lot of ground quickly while +1.4 means the move is grinding in the same direction but barely moving.
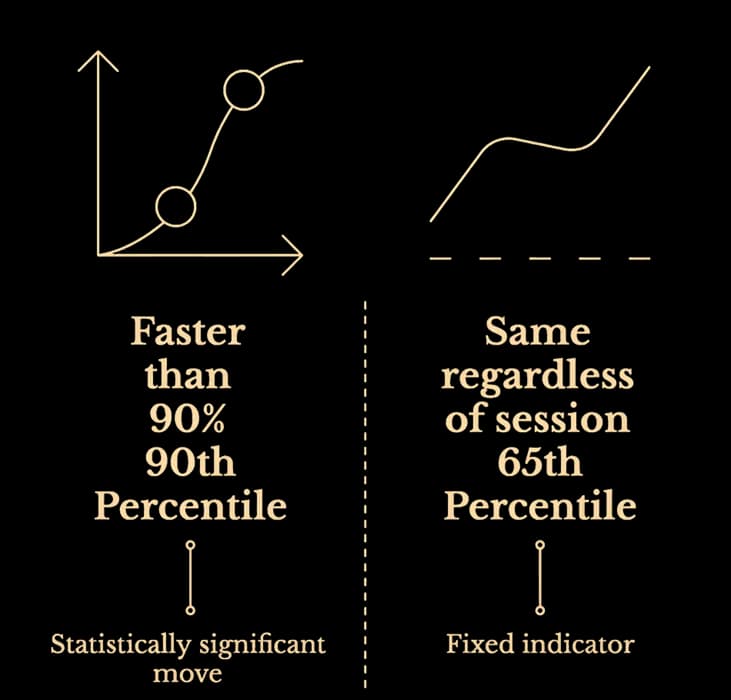
The more important context is the session percentile. A velocity reading of +8.0 might be fast in a quiet session and unremarkable in a volatile one, so session percentile answers the question that raw velocity can't: is this move fast or slow for today? A reading at the 90th session percentile means this swing is faster than 90% of the swings since the market opened, which makes it statistically significant regardless of the absolute number. RSI at 65 means roughly the same thing regardless of whether the session is volatile or dead. Velocity at the 90th session percentile means something precise: this move is unusually fast for today's conditions, and that distinction changes how you interpret what you're seeing.
The Three States of a Move
Any directional move passes through one of three velocity states, and each state has a different implication for what comes next, which is what makes velocity a decision input rather than just an observation.
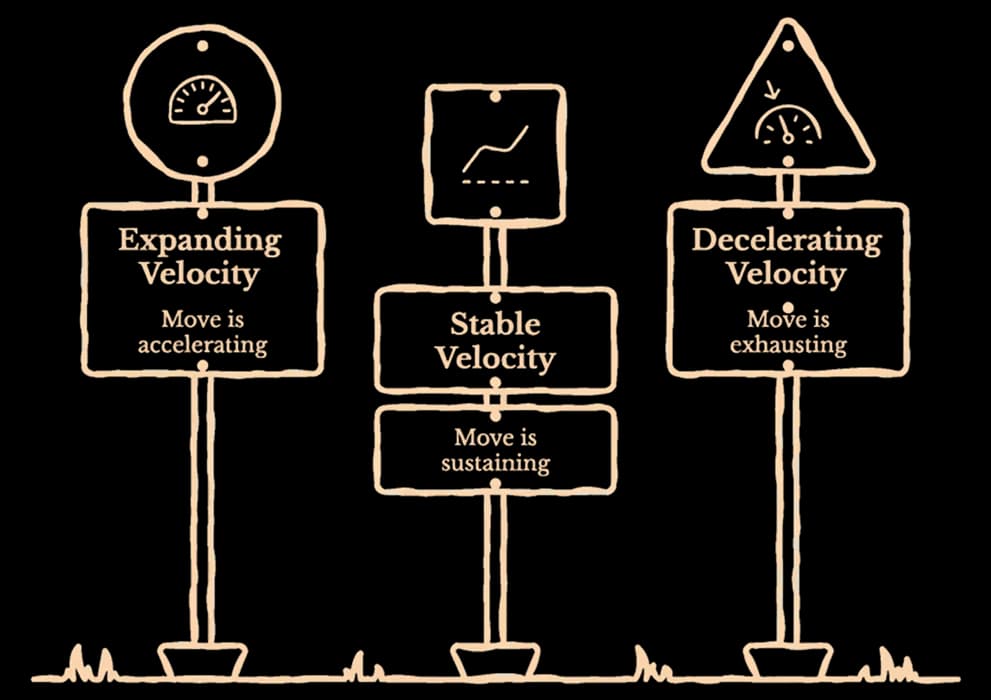
- Expanding velocity. The move is accelerating, with each successive swing covering more distance in less time. Positive velocity with increasing magnitude. This is a healthy, developing trend where the energy behind the move is growing and continuation is more probable than reversal. The correct posture here is to stay with the move rather than look for the exit.
- Stable velocity. The move is sustaining, with swings covering similar distance in similar time. Momentum is consistent but not building. This is the middle phase of a mature trend. The move still has energy but it isn't expanding, so continuation remains probable while the urgency to add to positions decreases.
- Decelerating velocity. The move is exhausting, with each swing covering less distance in more time, or the same distance in significantly more time. Positive velocity with decreasing magnitude. This is where most traders get caught. The direction hasn't changed and the chart still looks like an uptrend, but the pace is deteriorating, and deteriorating pace almost always precedes deteriorating structure. New entries don't make sense here, and existing positions deserve active management.
The transition from expanding to decelerating is where the edge lives, and it's rarely sudden. It builds across two or three swings, which is exactly why understanding the arc matters more than watching any single reading.
Acceleration — The Rate of Change of Velocity
Velocity tells you the pace of a single swing. Acceleration tells you how that pace is changing across swings, and reading both together is what surfaces the exhaustion signal before price confirms it.
Positive acceleration means swings are getting faster. Negative acceleration means swings are getting slower. The sign of acceleration always has to be read alongside the sign of velocity to understand what's actually happening. Positive velocity with negative acceleration means the move is still going up but slowing down, the early exhaustion fingerprint: direction intact while pace deteriorates. Negative velocity with positive acceleration means the downward move is losing conviction, which can be an early signal that sellers are running out of energy.
The most powerful signal acceleration produces is climactic detection. When the rate of momentum change reaches more than three standard deviations from its recent norm, a z-score beyond ±3, it sits outside roughly 99.7% of all readings, making the move a statistical extreme by definition. Draconic flags these climactic readings as exhaustion markers: not guaranteed reversals, but points where the probability of continuation at the same pace drops sharply. When you see a climactic reading, that's the moment to tighten your target, not add to the position.
Swing Duration — The Hidden Exhaustion Clock
Velocity captures pace as a rate, and swing duration captures it as time. The two tell slightly different stories, and together they describe what a move is actually costing the market.
In a healthy trend, swings are rhythmic. Each push takes roughly similar time to cover roughly similar distance. When that rhythm breaks, when the third swing is taking 41 minutes to cover what the first swing covered in 15, something structural is changing beneath the price chart that hasn't yet shown up in the candles.
Swing duration expansion is one of the most reliable exhaustion signals precisely because it's invisible on a standard chart. You'd have to manually time each swing and compare them across the session, which nobody does under live market conditions. But the pattern is consistent: as a trend exhausts itself, swings take progressively longer while covering progressively less ground. More time, less output. The market is spending increasing effort for decreasing result, and that dynamic has one resolution.
When you're in a position and the current swing has already taken twice as long as the previous two, the move isn't accelerating into a new leg. It's grinding, and once you can see the duration data, the decision to manage the position becomes obvious rather than uncomfortable.
What Changes When You Can See Velocity
The practical application isn't about finding entries on fast-moving velocity. That's a common misreading that leads to chasing. High velocity at the session percentile extremes (90th+) is often a warning, not an invitation. A move at the 95th session percentile is covering ground faster than 95% of today's swings, and the statistical probability of sustaining that pace is low.
The genuine edge is in three specific applications. First, filtering entries: before entering on a setup, check whether velocity is expanding or contracting, because an entry into a decelerating move is an entry against momentum quality even if the direction looks right. Second, managing exits: when velocity is decelerating across successive swings and swing duration is expanding, the position deserves closer management, not an immediate exit but tighter targets and more attention on the trail. Third, the second opinion before entry: "the setup looks clean, but velocity is at the 92nd session percentile" is information that changes the decision, not necessarily a veto but context that deserves weight.
Velocity doesn't tell you what price will do. It tells you the quality of what price is currently doing, and that's a different, more answerable question.
The Pattern Before the Reversal
Velocity deceleration rarely announces itself cleanly on a single swing. It builds across a sequence, which is why understanding the pattern matters more than watching any single reading.
The sequence that precedes most reversals in trending markets looks like this: first swing fast, session percentile high, acceleration positive. Second swing slower, percentile dropping, acceleration turning negative. Third swing slow, percentile low, swing duration expanded, z-score compressed. At this point the move is statistically spent, not reversed on the chart but exhausted in the data.
What typically triggers the actual price reversal is the moment when a counter-swing posts higher velocity than the most recent trend swing. When a pullback is moving faster than the advance it's pulling back from, sellers have more conviction than buyers. The chart might still show the trend intact, higher lows, no structural break. But the flow of energy has already reversed. Price follows.
Draconic, an AI trading intelligence platform, synthesises velocity alongside 176 other proprietary metrics in real time, tracking session percentile, acceleration state, swing duration, and climactic detection simultaneously across multiple timeframes. The synthesis surfaces the exhaustion pattern as it develops, not after it resolves into a price reversal.
Direction Is a Starting Point, Not an Answer
The chart shows where price went. Velocity shows how it got there and whether it still has the energy to keep going, and those are two different questions that require two different answers.
Most traders only ask the first one. A trend without velocity behind it is a chart pattern waiting to fail, and a trend with expanding velocity and consistent swing rhythm has structural strength that price alone can't convey. Reading both is what separates a complete read from an incomplete one. The reversal you didn't see coming was visible in the velocity data. It almost always is.
More like this
May 12, 2026behind-the-price
Sector Rotation — The Macro Signal Most Traders Ignore
The Draconic Team • 3 min
May 11, 2026behind-the-price
How Market Makers Create Invisible Floors and Ceilings
The Draconic Team • 11 min
May 8, 2026behind-the-price
The Magnetic Levels — Why Price Gets Drawn to Certain Numbers Near Expiry
The Draconic Team • 8 min
May 7, 2026behind-the-price
When Three Flow Signals Agree Against Price
The Draconic Team • 4 min