Monitoring Open Positions with Signals
The Problem
Knowing when to exit a trade is harder than knowing when to enter one. You're in a winning position, price has moved your way, and then it pauses. A small red candle. Then another. Your chart still looks fine, the trend hasn't broken, but something has shifted. Is this a healthy pullback inside a move that has more to give? Or is this the first sign of a reversal that will eat your open profit and then some?
Your gut says hold. Your fear says exit. You check the chart again, hoping a candle will resolve the question for you. It doesn't. So you sit there, toggling between conviction and anxiety, until the market decides for you.
This is where most traders lose money they already made. Not on bad entries. On exits that have no framework behind them.
KEY INSIGHT
A systematic exit framework monitors five independent signal categories in priority order: structural breaks, statistical exhaustion, flow shifts, velocity changes, and positioning shifts. Structure break is the highest priority because it invalidates the trade thesis. Statistical exhaustion is second because it flags unsustainable conditions before price confirms the turn. Monitoring all five removes gut-feel from the hold-or-exit decision.
What Changes With Synthesis
The traditional approach to managing an open position is remarkably primitive given how much sophistication traders apply to entries. Most traders watch price and one or two indicators. If price pulls back, they eyeball the depth of the pullback against the prior impulse and make a judgment call. If an indicator crosses a threshold, they consider tightening. The process is visual, sequential, and heavily influenced by the P&L number blinking on the screen.
The structural problem is that any single signal can mislead. Velocity might be slowing, but that could mean a healthy pause before continuation. CVD might dip, but that could be passive selling into a strong trend. A candle pattern might look bearish, but the higher timeframe structure is intact. Each dimension in isolation gives you partial information and insufficient conviction to act.
What changes with multi-dimensional monitoring is that you stop asking "is this one signal telling me to exit?" and start asking "are multiple independent signals converging on the same conclusion?" A velocity deceleration that coincides with CVD divergence, a structural break on the lower timeframe, and a gamma regime shift against your position is a fundamentally different situation from a velocity deceleration on its own. The first requires action. The second requires attention.
The method below gives you a hierarchy for reading those signals in real time, so the decision becomes procedural instead of emotional.
The Method
When to exit a trade: the five-signal hierarchy
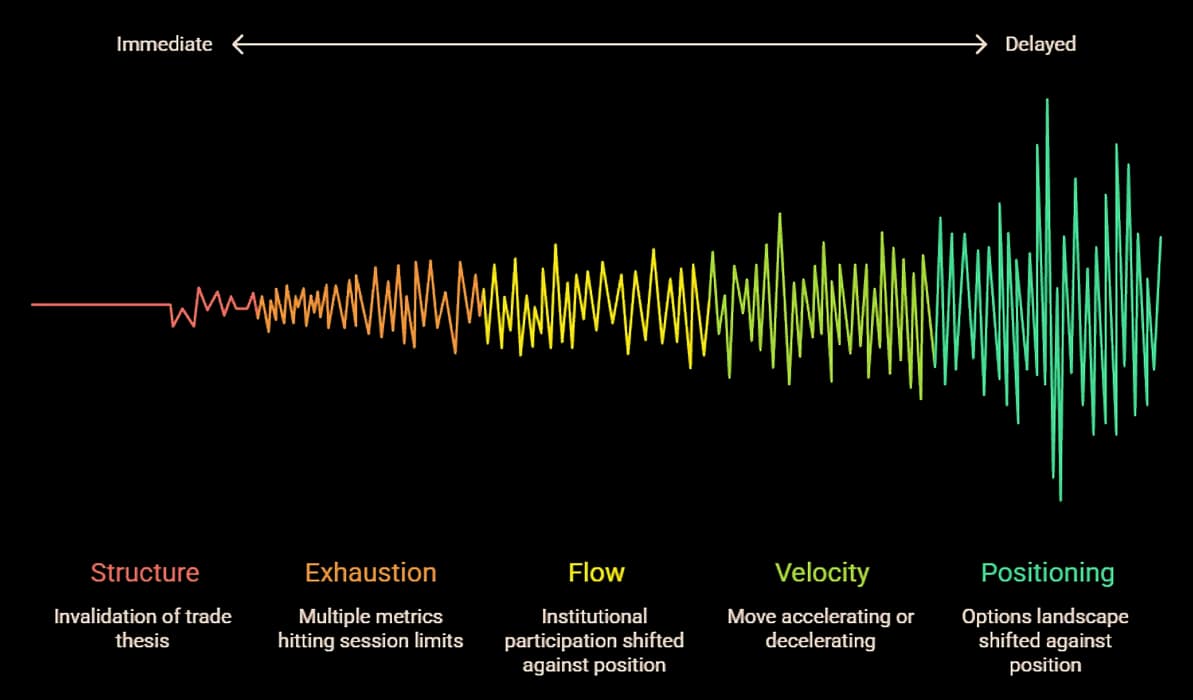
Five signal categories, ranked by priority. When you're in an open position, run through this hierarchy at every decision point: when price pauses, when you feel the urge to exit, or at predefined time intervals during the session. The ranking reflects how quickly each signal can invalidate your thesis and how much damage ignoring it can cause.
Step 1: Structure — has the trade thesis been invalidated? (Highest priority, 30 seconds)
Check whether a Change of Character (CHOCH) has occurred on the timeframe you used for entry. A CHOCH is the first structural break against the prevailing trend: in an uptrend, it's the first lower low. In a downtrend, it's the first higher high. This is the only binary signal in the hierarchy. If structure has broken on your entry timeframe, the thesis that justified the trade no longer holds. The appropriate action is to exit or reduce to minimum size immediately, regardless of what other signals show. A Break of Structure (BOS) in the trend direction, by contrast, confirms continuation.
Also check the higher timeframe structure. A CHOCH on the 1-minute inside an intact 15-minute uptrend is a lower-priority signal than a CHOCH on the 15-minute itself. Timeframe matters: a structural break on your entry timeframe or higher demands action. A structural break one timeframe below demands attention but not necessarily an immediate exit.
Step 2: Exhaustion — are multiple metrics hitting session limits? (High priority, 30 seconds)
Check whether statistical extremes are clustering. Individual metrics at the 90th or 95th session percentile are notable but common in strong moves. When two or more independent metrics reach extreme territory simultaneously, the probability of continuation drops sharply because multiple dimensions of the move are stretched beyond their normal session range.
The specific combination to watch: velocity at the 90th+ session percentile combined with swing duration expanding beyond the session average. If the current swing has lasted 40 minutes when the average swing today has been 18 minutes, that duration expansion signals time-based exhaustion regardless of what the candles look like. Add a climactic acceleration reading (z-score above 2.0) and you have a three-signal exhaustion cluster that precedes most significant reversals.
Action: when two or more exhaustion signals fire together, take partial profits or tighten your stop to the most recent structural level. Full exit if three or more fire simultaneously.
Step 3: Flow — has institutional participation shifted? (Medium priority, 1 minute)
Check CVD against price. If your long position is in profit and price is still near the highs, but CVD has started making lower highs, aggressive buying is fading. This is not an exit signal on its own. It is a warning that the fuel driving the move is thinning. The same logic applies in reverse for short positions: price still falling but CVD flattening or rising means aggressive selling is drying up.
Beyond CVD, check whether unusual options activity has appeared against your position. Large put sweeps while you're long, or call sweeps while you're short, suggest institutional money is positioning for a move against you. Again, this alone is not an exit trigger, because institutions hedge constantly. But flow divergence confirmed by one additional signal from another category in this hierarchy becomes actionable.
Action: when CVD diverges from price, move your mental state from "holding with conviction" to "holding with a plan to exit." If flow divergence is confirmed by a velocity change (Step 4) or an exhaustion signal (Step 2), act on the exit plan.
Step 4: Velocity — is the move accelerating or decelerating? (Medium-low priority, 30 seconds)
Check the rate of price change between recent swing points. If velocity is expanding (each swing completing faster than the last), the move has genuine momentum and continuation is likely. Hold with confidence. If velocity is contracting (each swing taking longer for the same distance), the move is losing energy even though it may still be going in your direction.
Decelerating velocity is the most misinterpreted signal in position management. It does not mean "exit now." It means the character of the move is changing from impulsive to corrective. The appropriate action is to tighten your stop to the most recent structural level and shorten your time horizon for the trade. If you were expecting a full-day trend, velocity deceleration suggests the current leg may be approaching its limit. Adjust your target, not necessarily your position.
Action: tighten stops. Reduce target expectations. Do not exit solely on velocity deceleration unless it coincides with a signal from a higher-priority category.
Step 5: Positioning — has the options landscape shifted against you? (Lowest priority, 1 minute)
Check whether the gamma regime has changed or whether put/call walls have moved against your position since entry. If you entered long in a positive gamma environment (dampened, range-bound) and gamma has flipped negative during the session, the mechanical forces supporting your trade have changed. Positive gamma dampens declines and supports your position. Negative gamma amplifies declines and works against it.
Similarly, if the call wall has moved closer to your entry (new resistance forming above) or the put wall has moved away below (support withdrawing), the positioning landscape has deteriorated. These are slow-moving signals that rarely demand immediate action, but they change the risk profile of holding the position overnight or through a key session.
Action: adjust your expectations for how the rest of the session will behave. A gamma flip mid-session is context for every other signal in the hierarchy. It doesn't trigger an exit alone, but it changes how you interpret velocity pauses and flow shifts. In positive gamma, a pullback is likely to be bought. In negative gamma, the same pullback may accelerate.
In Practice
NIFTY, Thursday afternoon. You entered long at 23,180 on the 5-minute chart after a demand zone held with expanding velocity and positive CVD. Price is now at 23,260. You're up 80 points. Then price stalls. Three small-bodied candles in a row, going nowhere. Your P&L is flickering. Here's how the hierarchy reads the situation.
Structure: no CHOCH on the 5-minute. The most recent higher low at 23,220 is intact. The 15-minute structure is bullish. No action needed from the highest-priority signal.
Exhaustion: velocity is at the 87th session percentile. Elevated but not extreme. Swing duration on the current up-leg is 22 minutes, session average is 19 minutes. Slightly stretched but not abnormal. No exhaustion cluster. Continue holding.
Flow: CVD made a new high alongside price at 23,260. No divergence. Aggressive buying is intact. No warning from flow.
Velocity: the last three swings completed in 19, 21, and 22 minutes respectively. Mild deceleration. The move is slowing but not dramatically. Tighten the mental stop from the original 23,140 to 23,220 (the last structural higher low). No exit.
Positioning: gamma is still positive, put wall at 23,100, call wall at 23,300. The positioning landscape supports the position. No change needed.
The read: all five categories say hold. The only adjustment is a tighter stop based on mild velocity deceleration. Fifteen minutes later, price breaks above 23,280 with a velocity spike and CVD confirmation. The hierarchy just kept you in a trade that your anxiety was trying to close.
Now contrast: same setup, but at 23,260 the hierarchy reads differently. CVD has diverged (price at the high, CVD making a lower high). Velocity has decelerated to the 94th session percentile. And on the 5-minute chart, a CHOCH just printed as price broke below 23,245. Three categories are flagging simultaneously. Structure is broken, exhaustion is clustering, flow has diverged. The hierarchy says exit now. Not tighten, not wait. Exit.
Common Mistakes
- Monitoring only price and P&L. The blinking P&L number is the worst decision input during a live trade. It tells you nothing about whether the conditions that created the profit still exist. Traders who watch P&L exit winners when a normal pullback temporarily reduces their gain and hold losers because "it might come back." The hierarchy replaces P&L-watching with signal-watching.
- Treating every signal as an exit trigger. Velocity deceleration alone is not a reason to exit. CVD dipping is not a reason to exit. A single exhaustion metric at an elevated percentile is not a reason to exit. The hierarchy exists because these signals carry different weights. Acting on every warning independently leads to exiting good trades prematurely. The question is always: "Is this signal confirmed by another category?"
- Skipping the hierarchy when winning. The temptation to "just let it ride" increases with profit size. But the market doesn't know your entry price. The conditions that supported the trade at entry can deteriorate regardless of how much you're up. Running the hierarchy at regular intervals, especially when things are going well, is what separates systematic management from hope.
FAQs
A structural break on your entry timeframe is sufficient on its own. CHOCH means the sequence of higher highs and higher lows (or lower lows and lower highs) that defined your trade thesis has broken. That is a thesis-level invalidation, not a warning. Exit or reduce immediately, then reassess.
At every meaningful pause in price action, and at minimum every 15 minutes during an active session. For scalpers on 1-minute charts, compress that to every 3-5 minutes. The hierarchy takes 2-3 minutes to run through manually, or seconds with synthesis.
The same categories apply, but the timeframes shift. For overnight holds, run the hierarchy on the daily and 4-hour charts. Positioning (Step 5) becomes higher priority for overnight holds because gamma regime and wall shifts have hours to develop and can change the session's character by the next morning.
Run the hierarchy anyway. It works for any open position regardless of how you entered. If the hierarchy shows structure intact, no exhaustion, supportive flow, and velocity still expanding, the position may still be valid even if your entry was impulsive. If multiple categories are flagging against you, exit and accept the cost of an undisciplined entry.
Partial automation works well. Set alerts for structural breaks (CHOCH) and exhaustion clusters (2+ metrics at extremes). These are the highest-priority signals and the ones most likely to be missed during the emotional intensity of managing a live position. The lower-priority signals (velocity, positioning) are better assessed contextually than through fixed-threshold alerts.
Relevant
See what real-time position monitoring looks like with multi-dimensional synthesis
This guide is for informational and educational purposes only. It does not constitute financial advice. Trading involves risk. Draconic provides market intelligence; all trading decisions are your own.