The Liquidity Game — How Institutions Fill Orders by Taking Your Stops
What is stop loss hunting and why does it happen?
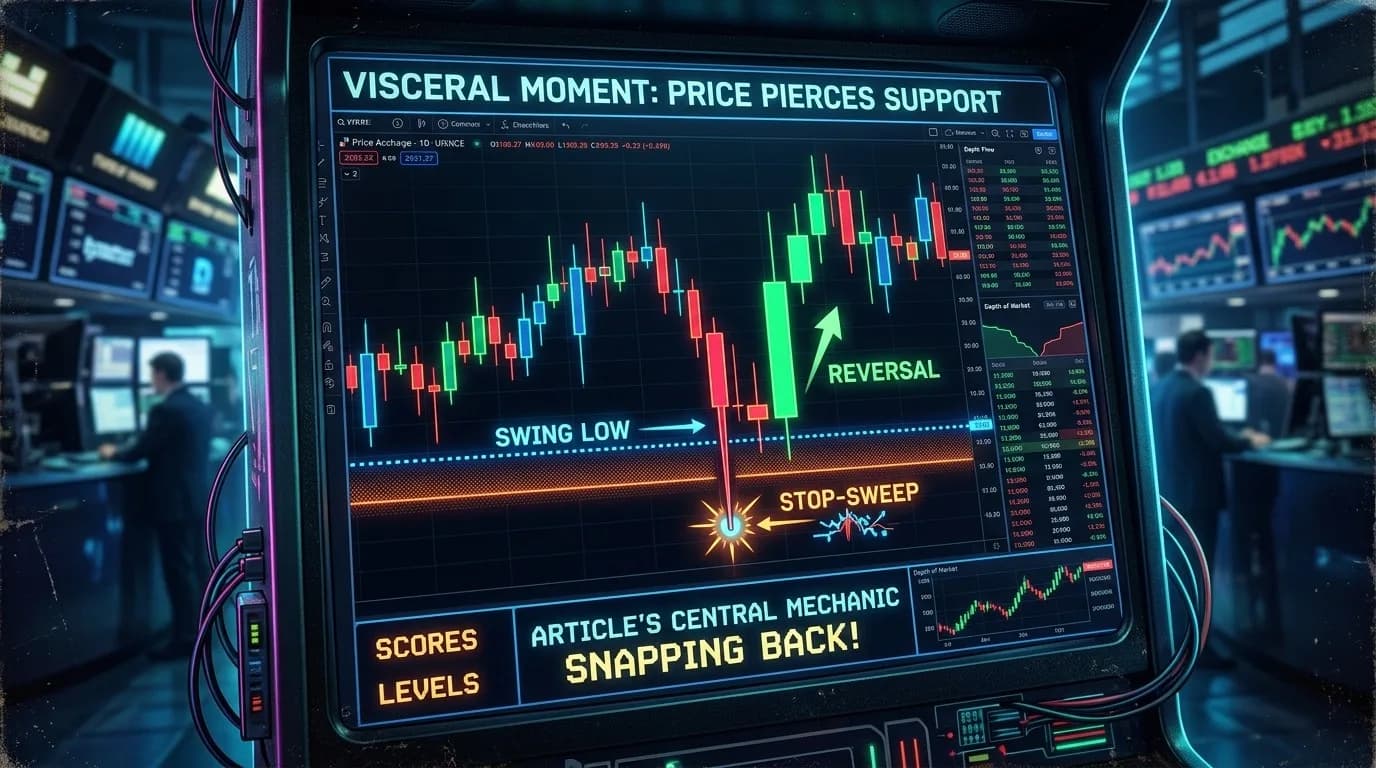
Stop loss hunting isn't a conspiracy — it's a liquidity mechanic. Institutions can't fill 50,000 lots at a single price without moving the market against themselves, so they sweep the deepest predictable pool of opposite-side orders: stops resting just below swing lows or above swing highs. The sequence is consistent: price pierces the level, triggered stops cascade as market orders, the institution absorbs that flow to fill its position, and price reverses because no genuine sellers remain. The fix is placing stops beyond the expected sweep zone and reading completed sweeps as entries, not breakdowns.
Your stop gets hit at the exact low of the move. Price reverses within seconds and runs precisely where you expected. You're sitting flat, watching the trade you were right about print money for someone else.
It happens often enough that stop loss hunting has become a common explanation in every trading community. But most traders treat it as a vague conspiracy — market makers targeting retail, brokers running stops, some invisible hand punishing small accounts. The frustration is real. The explanation is wrong.
It's not personal. It's a liquidity mechanic, and it follows a sequence you can read before it happens. Once you understand why your stop is valuable to someone with a large order to fill, you stop being the liquidity and start mapping where it sits.
Why Stop Loss Hunting Is a Liquidity Problem, Not a Conspiracy
Institutions can't execute large orders at a single price without moving the market against themselves. A fund buying 50,000 lots of NIFTY futures needs counterparties willing to sell, and the deepest predictable pool of sell orders sits just below visible swing lows, exactly where retail traders place their stops. Sweeping those clusters isn't manipulation; it's how large orders get filled.
The mechanic is straightforward. When price drops through a swing low, every stop-loss order beneath it converts into a market sell order. That cascade of selling is precisely what the institution needs to fill its buy. The stops aren't collateral damage from the move. They're the reason for it.
Research by Osler (2005), published in the Journal of International Money and Finance, documented this dynamic in currency markets. The study found that stop-loss orders cluster predictably at round numbers and technical levels, and that these clusters attract price movements which trigger the stops before reversing. The mechanic isn't limited to forex. It operates wherever stop-loss orders concentrate at foreseeable prices, which includes equities, indices, futures, and crypto on centralised exchanges.
SEBI's 2023 study on F&O trader performance found that 89% of individual traders lost money over a three-year period, with a significant portion of losses tied to adverse timing of entries and exits. The study didn't name liquidity hunting specifically, but the pattern it described — retail positions closed at extremes before price reversals — is consistent with the structural dynamic that institutional order filling creates in derivative markets.
The Three Steps of a Liquidity Sweep
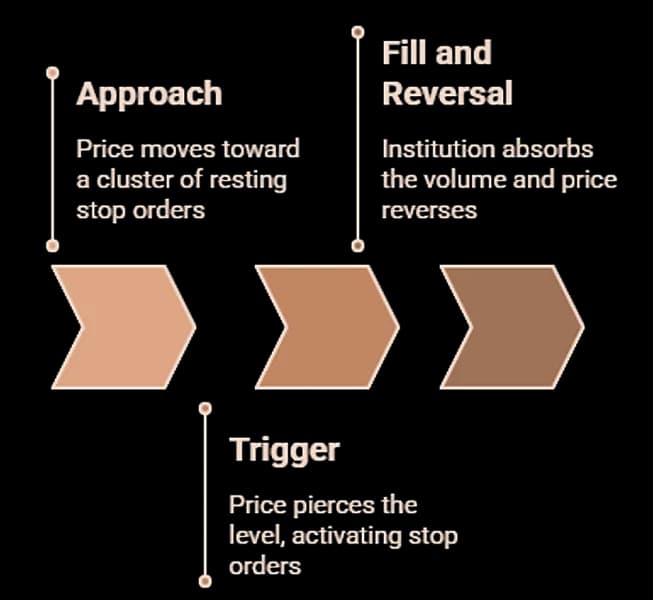
A liquidity sweep follows a consistent sequence: price approaches a cluster of resting stop orders, the stops trigger and generate a burst of volume in the sweep direction, and an institution absorbs that burst to fill its position on the opposite side. The reversal isn't coincidence. The selling pressure was artificial, manufactured by triggered stops rather than genuine directional conviction.
- Step one is the approach. Price moves toward a level where stops are likely to sit, typically just below a recent swing low for sell-side liquidity, or just above a swing high for buy-side liquidity. The approach can look like a legitimate breakdown on a standard chart. Momentum indicators may confirm the direction. Traders watching the move unfold see what appears to be a clean break of support.
- Step two is the trigger. Price pierces the level by a small margin, enough to activate the resting stop orders. Each triggered stop becomes a market order, and the cascade generates a brief but intense flow of volume in the sweep direction. On the NSE, where F&O activity creates enormous stop-loss density around key option strikes, this cascade can be particularly sharp. NSE market microstructure data shows that volume spikes at intraday swing extremes frequently coincide with rapid reversals within the same session, a pattern consistent with stop-triggered liquidity events rather than genuine directional breaks.
- Step three is the fill and reversal. The institution absorbs the cascade. Stop-triggered sell orders become its buy fills. Once the position is filled, the artificial selling pressure disappears and price reverses because no genuine sellers remain at that level. The chart shows a wick: a brief spike through the level that immediately retracts. The SEC's 2020 Market Structure Advisory Committee report noted that institutional execution strategies frequently involve accessing liquidity at predictable price levels where resting orders cluster, and that the interaction between institutional algorithms and retail stop-loss placement creates systematic patterns in intraday price behaviour.
Where Stops Predictably Cluster and Why Tested Levels Are the Most Vulnerable
Stop-loss orders accumulate at three predictable locations: just below swing lows in uptrends, just above swing highs in downtrends, and beyond round psychological numbers where traders anchor decisions. These clusters are readable by anyone who maps recent swing structure, because each swing point that holds creates a fresh layer of protective orders beneath or above it.
The logic follows directly from how traders manage risk. A trader who buys a pullback to a swing low places their stop just below it. A trader who sells a rally to a swing high places their stop just above. Every time a level holds, another layer of stops accumulates at the same zone.
This creates a paradox that most traders experience with support levels without understanding why. A level tested three times looks strong, with three bounces and three confirmations. But each bounce also added another layer of stops below the level. By the third test, the liquidity pool beneath that "strong support" is at its deepest, and the incentive for an institutional sweep is at its highest. Currency-market microstructure research by economist Carol Osler (Journal of International Money and Finance, 2005) documented that stop-loss orders cluster at predictable price levels, and that large participants' responses to those clusters produce rapid, self-reinforcing "price cascades" — large players systematically identify predictable concentrations of resting orders as part of standard pre-trade analysis.
Reading where unswept pools sit comes down to tracking swing structure. An unswept swing low is a level that was established but hasn't been revisited since. The more prominent the swing (visible on a higher timeframe, tested multiple times, sitting near a round number), the denser the expected stop cluster and the higher the probability that price will eventually sweep it. A recently swept swing low, by contrast, has had its liquidity cleared. The stops that were there have already been triggered, which means the level no longer attracts the same institutional interest.
Positioning Around the Sweep Instead of Inside It
Seeing where liquidity pools sit before they're swept changes three practical decisions: where to place a stop so it survives the sweep, whether a level break is a genuine move or a grab, and when a completed sweep creates an entry on the other side. Each of these requires knowing which pools remain unswept and which have been cleared.
The first adjustment is stop placement. Most traders place stops just below the nearest swing low, which puts them directly inside the liquidity cluster. Moving the stop to a level beyond the expected sweep zone — below the next significant structural level rather than just below the nearest swing — means the stop survives the cascade that takes out tighter positions. This costs a wider stop, which means sizing down to maintain the same dollar risk. That trade-off is worth making, because a wider stop that survives beats a tighter stop that gets hunted on a wick.
The second adjustment is reading breakdowns differently. When price pierces a swing low but does so on a single sharp wick that immediately retracts, that's a completed sweep, not a genuine breakdown. A real breakdown shows acceptance below the level: time spent there, volume traded there, candles closing beneath it. A sweep retracts quickly because the selling was mechanical, not directional. Knowing the difference prevents entering short at the exact moment institutions are buying.
The third adjustment is using completed sweeps as entries. Once a pool has been swept, with stops triggered and orders filled, the cluster that attracted the sweep no longer exists. That post-sweep reversal, particularly when confirmed by flow indicators turning in the new direction, is one of the higher-probability setups in intraday trading.
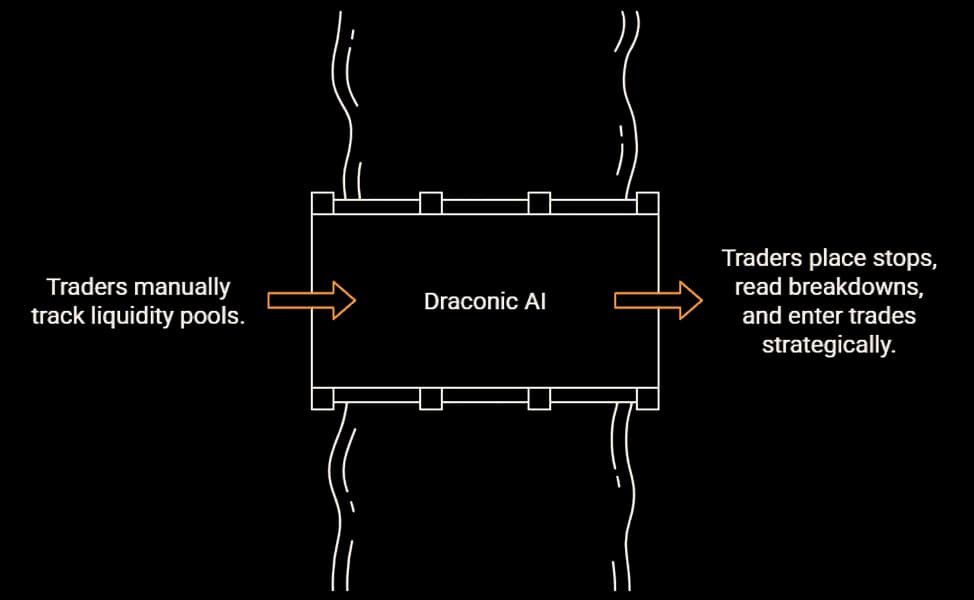
Draconic, an AI trading intelligence platform, maps these pools automatically by tracking swing structure across timeframes and flagging which pools remain unswept versus which have been cleared. Instead of scanning swing points manually and trying to remember which levels have been revisited, the synthesis shows every pool, its status, and the structural context surrounding it in one view.
The trader decides how to position around the information. Draconic shows where the liquidity sits and whether it's been taken.
The Stop That Survives
The stop that gets hit at the exact low isn't bad luck, and it isn't a broker conspiracy. It's a liquidity event that follows a readable sequence, and it's preventable once you know where unswept pools sit relative to your position. The traders who keep getting stopped out at extremes aren't wrong about direction. They're positioned inside the liquidity instead of around it.
Understanding the sweep mechanic is the foundation. The next layer is understanding how market makers create broader invisible floors and ceilings through their hedging activity, which operates on a larger scale than individual stop clusters.
See where liquidity pools sit before the sweep happens — explore Draconic.
More like this

July 4, 2026ai-trading
Chartink Alternative: Draconic vs Chartink
The Draconic Team • 6 min
July 4, 2026ai-trading
Sensibull Alternative: Draconic vs Sensibull
The Draconic Team • 6 min
May 12, 2026behind-the-price
Sector Rotation — The Macro Signal Most Traders Ignore
The Draconic Team • 3 min
May 11, 2026behind-the-price
How Market Makers Create Invisible Floors and Ceilings
The Draconic Team • 11 min