How Market Makers Create the Price Map You Can't See
The Problem
Price bounces at a level that doesn't appear on any chart. No trendline, no moving average, no historical support. Just a clean bounce at a price that shouldn't matter. But it does. And it keeps happening.
You draw a horizontal line after the fact and call it "discovered support." But that doesn't explain why the level existed in the first place. No one drew it before the bounce. No indicator flagged it. The chart gave you nothing.
The explanation isn't on the chart. It's in the options market. Every time a market maker sells an option, they create a hedging obligation that translates directly into buying or selling pressure at specific prices. Those obligations create mechanical levels: floors where hedging forces buying, ceilings where hedging forces selling. The levels are invisible on a standard chart but fully derivable from options positioning data.
KEY INSIGHT
Options market makers hedge their positions by buying and selling the underlying. This hedging creates mechanical price levels: floors where hedging generates buying pressure, ceilings where hedging generates selling pressure. These levels are invisible on a standard chart but derivable from options positioning data. They explain why price reacts at levels no technical indicator predicts.
What Changes With Synthesis
The traditional approach to support and resistance relies on historical price action. You look at where price bounced before, draw a line, and assume it matters again. Sometimes it does. But the mechanism is backward-looking and offers no explanation for why a level should hold. When a "strong support" breaks without warning, the chart gives no reason.
Market maker hedging creates levels that are forward-looking. They exist because of current options positioning, not because of what price did last month. A put wall at 23,200 creates buying pressure at 23,200 right now, regardless of whether price has ever bounced there before. The level is mechanical, not historical.
The challenge is that reading these levels manually requires aggregating gamma exposure across every strike, determining the net hedging direction at each price, and recalculating as positions change throughout the session. That's spreadsheet work, not trading work. Multi-dimensional synthesis collapses this into a single question: where are the mechanical levels today, and what regime are we in? The answer includes the floors, the ceilings, the flip level, and how price is likely to behave near each one.
The method below teaches the mechanics step by step: how a single options trade creates a hedging obligation, how millions of them aggregate into a price map, and how to read the map before the session begins.
The Method
How market maker hedging creates the price map
Step 1: Understand the hedging chain (the mechanic)
Start with one trade. A retail trader buys a NIFTY 23,300 call from a market maker. The market maker is now short that call, which means they're exposed to upside risk. If NIFTY rises, the call gains value and the market maker loses money on the position.
To neutralize this risk, the market maker buys NIFTY shares (or futures) proportional to the option's delta. If the call has a delta of 0.40, the market maker buys enough of the underlying to offset 40% of the directional exposure. This is delta hedging.
Now the critical part: delta changes as price moves. If NIFTY rises toward 23,300, the call's delta increases. The market maker must buy more shares to stay hedged. If NIFTY falls away from 23,300, delta decreases, and the market maker sells shares.
This single trade creates a feedback loop. Price rises toward the strike, the market maker buys. Price falls away, the market maker sells. Multiply this by thousands of open contracts across dozens of strikes, and the aggregate hedging activity creates measurable buying and selling pressure at specific price levels.
Put options work in reverse. When a market maker sells a put, they hedge by selling the underlying. As price drops toward the put's strike, delta increases and the market maker sells more. As price rises away, they buy back.
The result: call concentration at a strike creates selling pressure as price approaches from below (a ceiling). Put concentration creates buying pressure as price approaches from above (a floor). These are not theoretical levels. They are the mechanical consequence of hedging obligations that market makers must fulfill to maintain delta neutrality.
Step 2: Identify the gamma regime (the rules of the game)
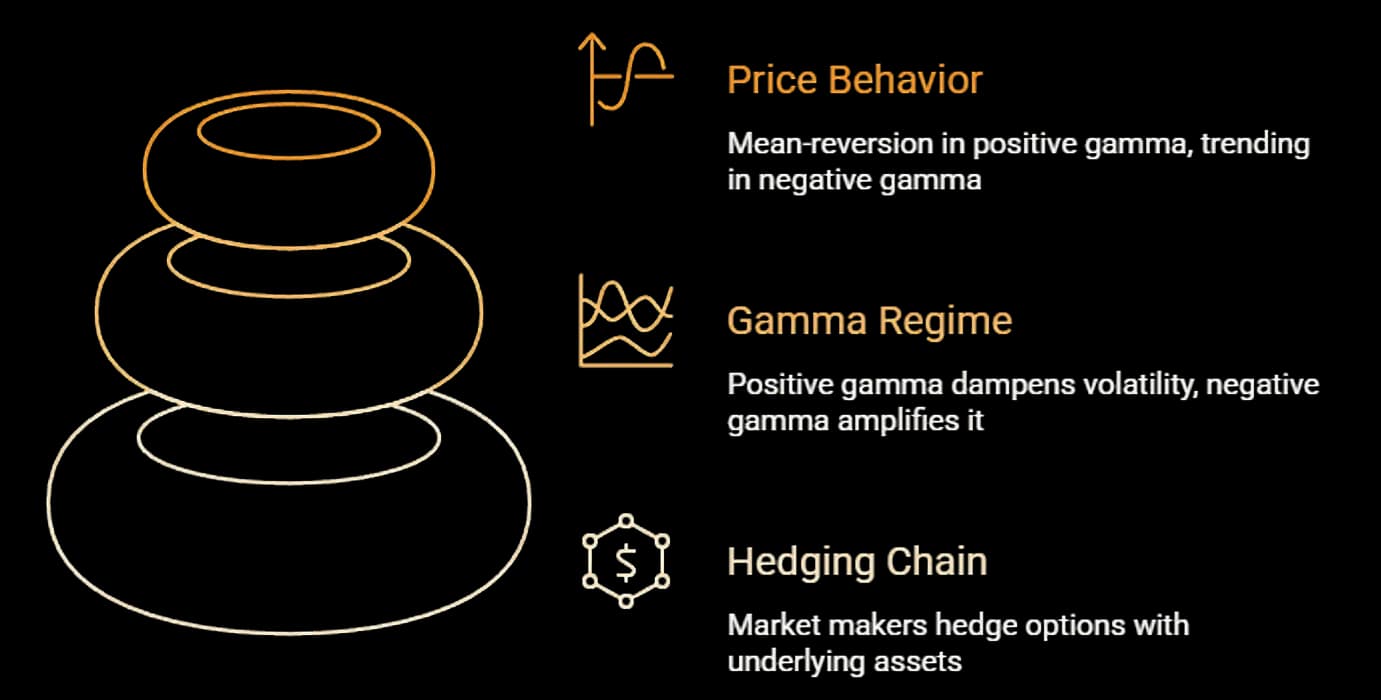
Gamma determines how aggressively the hedging adjustments happen. In a positive gamma environment, market makers are net long gamma. Their hedging works against the prevailing price direction: they buy when price drops and sell when price rises. This dampens moves, compresses volatility, and creates range-bound behavior. Price tends to bounce between the put wall and call wall without breaking through.
In a negative gamma environment, the hedging flips. Market makers sell when price drops and buy when price rises. This amplifies moves, expands volatility, and creates trending or breakout behavior. The same level that held perfectly in positive gamma gets sliced through in negative gamma because the hedging force is now pushing in the same direction as the move.
The gamma flip level is the price where the regime transitions. Above the flip, one set of rules applies. Below it, another. This is the single most important level that never appears on a chart, because it's derived entirely from options positioning.
Before you trade, determine three things: is aggregate gamma positive or negative? Where is the flip level? And where are the put and call walls? These three data points define the mechanical landscape for the session.
Step 3: Map the price behavior onto your plan (the application)
Once you know the regime and the levels, you can map expected behavior onto your trading plan.
In positive gamma above the flip level, expect mean-reversion. Breakout strategies will struggle because hedging forces buy every dip and sell every rally. Range trades work well. The put wall and call wall define the likely range, and price tends to oscillate between them.
In negative gamma below the flip level, expect trend continuation. Breakdowns that wouldn't sustain in positive gamma can accelerate because hedging amplifies the move. Stops placed near the put wall are more vulnerable because the hedging force sells into the decline rather than buying it. Trending strategies and breakout entries have better odds.
Near the flip level itself, expect instability. Price crossing the flip level changes the regime, which changes the hedging behavior, which can accelerate the move through the level. The flip level is where the environment shifts, and positioning for the transition is one of the highest-edge applications of this framework.
In Practice
Thursday morning, NIFTY opens at 23,280. The chart shows price sitting just above a horizontal level at 23,200 that held twice last week. A chart-only read says: support at 23,200, watch for a bounce if price pulls back.
The options positioning tells a different story. Put concentration is heaviest at 23,200 (the put wall), call concentration peaks at 23,400 (the call wall), and the gamma flip level sits at 23,250. Aggregate gamma is positive. Max pain is at 23,300.
With price at 23,280, we're in positive gamma territory, 30 points above the flip level. The mechanical landscape is clear: market makers will buy dips toward 23,200 and sell rallies toward 23,400. The 23,200 level isn't holding because of last week's bounces. It's holding because hedging obligations force buying there. Range between 23,200 and 23,400, with mean-reversion the dominant behavior.
At 1:15 PM, price dips to 23,210. Aggressive selling on the chart, momentum indicators turning bearish, and two consecutive red candles with expanding bodies. A chart-only trader sees breakdown risk. But at 23,210, the market maker hedging force is buying. Within twelve minutes, price recovers to 23,260. The put wall held, not because of a line on a chart, but because hedging mechanics forced buying at that level.
Now consider the same setup with one change: gamma is negative instead of positive. Same put wall at 23,200, same price dip to 23,210. But in negative gamma, market makers sell into the decline rather than buy it. The hedging force amplifies the drop instead of cushioning it. Price breaks 23,200, triggers stops clustered below, and accelerates to 23,150 before finding any natural buying interest. The chart looked identical. The options positioning was different. The outcome was opposite.
Common Mistakes
- Treating GEX as a directional signal. Positive gamma doesn't mean bullish. It means dampened. Negative gamma doesn't mean bearish. It means amplified. The regime tells you how price will move, not which direction. Confusing regime with direction leads to trades that misread the environment entirely.
- Ignoring intraday regime shifts. The gamma flip level isn't fixed for the day. As options are traded, OI shifts, and the flip level can move. A session that starts in positive gamma can transition to negative gamma if enough put positions are opened or call positions closed. Checking the regime once at market open and assuming it holds all day is a common and costly simplification.
- Applying the framework to illiquid options. Market maker hedging creates meaningful mechanical levels only when hedging volume is a significant fraction of total volume. This holds for liquid index options like NIFTY, BankNIFTY, and SPX. For individual stock options with thin OI, the hedging flows are too small relative to overall trading volume to create reliable mechanical levels.
FAQs
Traditional support and resistance is backward-looking: price bounced here before, so it might again. Market maker levels are forward-looking: hedging obligations create buying or selling pressure at specific prices right now, regardless of price history. The mechanism is different, which is why market maker levels appear at prices that have no historical significance.
In theory, yes. In practice, risk management mandates at major firms require delta neutrality within defined tolerances. Market makers who don't hedge accumulate directional risk that can produce catastrophic losses on large moves. The hedging is systematic and ongoing, which is precisely what makes the resulting price levels reliable.
Only where liquid, centralized options markets exist. Bitcoin options on Deribit and CME have sufficient OI for meaningful GEX analysis. Most other crypto assets lack the options infrastructure for reliable market maker hedging analysis. The framework applies to the instrument class, not the market, so the key question is always whether the options market is liquid enough to generate significant hedging flows.
The levels are derivable from current open interest, which is available before market open. The gamma regime and flip level can be calculated from overnight OI data. Levels shift during the session as options are traded, but the pre-market read provides a reliable starting framework that typically holds for the first half of the session.
Because they're derived from options data, not price data. Standard charting tools display price-based indicators: moving averages, pivot points, Fibonacci levels. Market maker levels require aggregating gamma exposure across all strikes and expiries, which is an options analytics calculation, not a charting function.
Relevant
See today's mechanical price map
This guide is for informational and educational purposes only. It does not constitute financial advice. Trading involves risk. Draconic provides market intelligence; all trading decisions are your own.