What the Data Showed When You Panicked

How do you stop emotional trading mistakes in real time?
Standard advice (label the emotion, pause, journal it) addresses awareness but not resolution. The fix is converting the impulse into a data question. "I'm missing this move" becomes "is this move statistically extended?" "I need my money back" becomes "does a setup exist by my usual criteria right now?" "It'll come back" becomes "have the structural signals supporting my thesis held or broken?" Each of the four classic mistakes (FOMO entries, revenge trades, holding past invalidation, cutting winners early) has a quantifiable answer visible at the moment of decision.
You watched NIFTY climb for forty minutes, hesitated twice, and finally bought near the session high. Within six candles, you were underwater. Or you took a loss on a BTC swing trade, felt the sting, and opened another position within seconds because the market owed you a recovery.
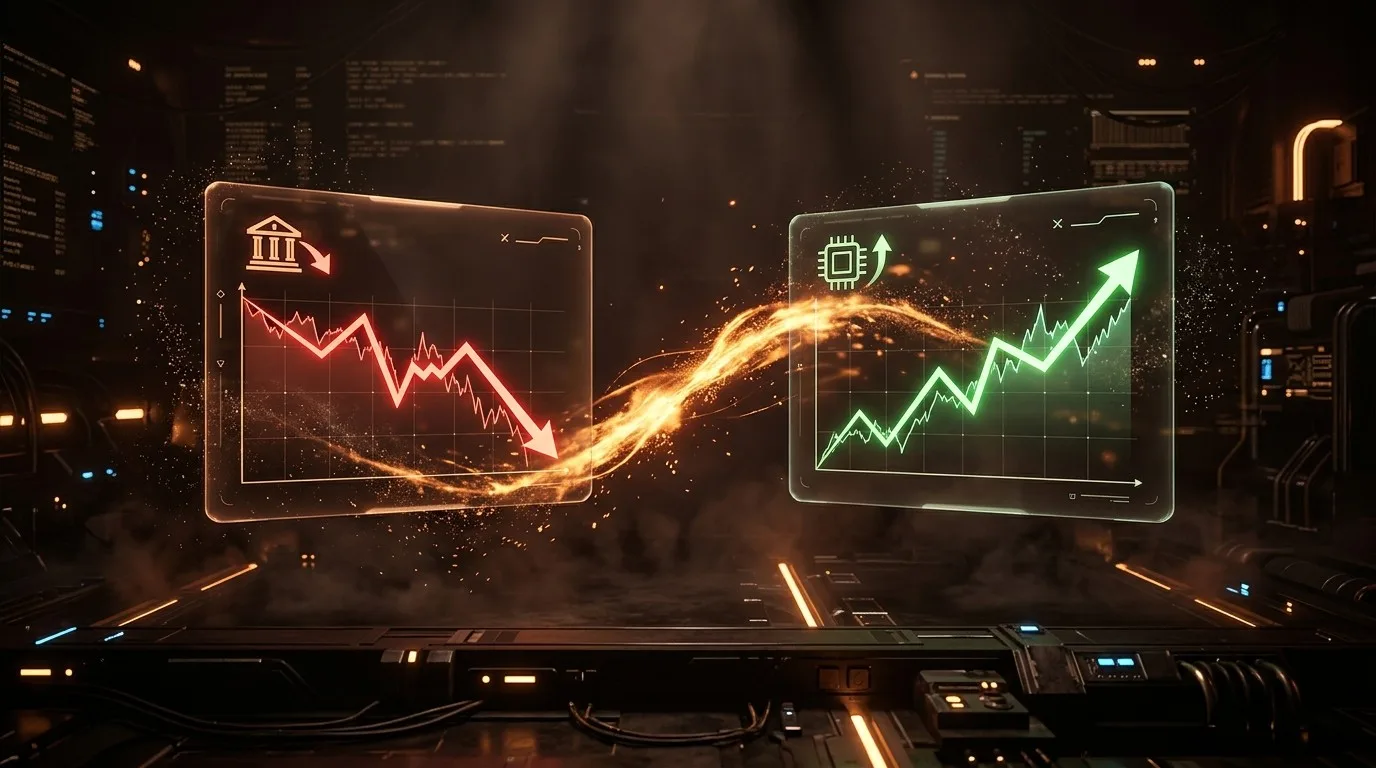
Whether you trade NIFTY options, SPY futures, or BTC spot, the same emotional trading mistakes produce the same kinds of losses. SEBI's 2023 study of 1.5 crore F&O traders found that 89% lost money over a three-year period, and the behavioural patterns behind those losses repeat consistently across experience levels. The gap between knowing trading psychology matters and preventing those mistakes in real time is where the damage happens. The standard advice says recognise the emotion, pause, journal it. That's correct, and it isn't enough. The harder question isn't what you felt. It's whether the data supported the feeling at all.
Why Trading Psychology Advice Leaves the Hardest Problem Unsolved
Standard trading psychology advice tells traders to label emotions and pause before acting. That addresses awareness but not resolution. The structural problem is that traders have no real-time way to test whether their emotional read matches what market data is actually showing, so the feeling fills the information gap unchallenged and drives the decision unchecked.
Recognising FOMO doesn't tell you whether the move you're watching is statistically extended. Recognising revenge impulse doesn't tell you whether a legitimate setup exists right now. The emotional label is accurate but insufficient because it can't distinguish between "I feel fear and the fear is irrational" and "I feel fear and three independent data signals are confirming the danger." Those are radically different situations that require different responses, and self-awareness alone conflates them.
Research by Brad Barber and Terrance Odean at UC Davis, published in The Journal of Finance in 2000, found that the most active retail traders underperformed passive investors by 6.5% annually. The shortfall wasn't from poor stock selection. It came from trading decisions driven by psychological biases that went unchecked because traders had no objective reference point at the moment of choice. The emotion drove the action, and nothing in the workflow challenged it with data.
This is the gap that self-awareness alone doesn't close. You can name the emotion. You can step back. But without knowing what velocity, flow, momentum, and structural positioning showed at that specific instant, the pause just delays the same uninformed decision. What changes when you can see the data at the moment of emotion isn't the feeling itself. It's whether the feeling gets the final word.
Arriving at the End of a Move You Thought Was Starting
FOMO entries fail most often not because the direction is wrong but because the timing places the trader at the tail end of a move that's already statistically exhausted. The entry happens at the point where continuation requires something unusual from the market, and the data showing that exhaustion exists before the click happens.
Every trading floor, every prop desk, every retail account has a version of this story. The specifics change but the pattern doesn't. Someone watched a move they'd identified early, waited too long to act, and entered at the point where multiple quantifiable dimensions were signalling extension.
The scenario plays out predictably. NIFTY rallied 180 points in the first hour. You watched from the sideline, hesitated at 22,300, hesitated again at 22,380, and entered at 22,440. The rally stalled within minutes. The direction was right. The timing was catastrophic.
What would objective data have shown at 22,440? Price velocity sat at the 94th session percentile, meaning the move was running faster than 94% of all moves in that day's session. Swing duration had expanded from 12 minutes to 38 minutes across three consecutive swings, covering roughly the same distance each time but taking progressively longer. That progressive expansion is the signature of time-based exhaustion. RSI was at the 91st session percentile for the day.
Andrew Lo and Dmitry Repin at MIT published a study in the Journal of Cognitive Neuroscience in 2002 measuring real-time physiological responses of professional traders during live sessions. They found that even experienced professionals exhibited significant autonomic nervous system activation during volatile price moves, and that these physiological responses correlated directly with deviations from stated trading rules. The body responds before the rational mind processes the situation, and the response intensifies the longer you've been watching a move you haven't entered.
None of this means the FOMO feeling was wrong about direction. NIFTY might well have continued higher later in the session. But at the moment of entry, every quantifiable dimension was saying the same thing: this particular move, right now, is extended. You didn't miss the move. You arrived at its end. Three independent signals showed it, and all three were visible before the order went through.
When Your P&L Writes the Next Trade's Thesis
Revenge trading happens when the motivation for entering a position comes from the previous loss rather than from any signal the market is currently producing. The distinguishing feature isn't aggression or speed. It's that the trade thesis, if you wrote it down honestly, would reference the loss that preceded it rather than any current market condition.
The mechanics are predictable. You shorted SPY after a $400 loss that stung, and the entry had no structural basis. No confluence across independent signal categories. No CVD confirmation of aggressive selling. No higher timeframe agreement with the direction. The setup had one confirming signal where your usual standard requires four. But the urgency of recovering the loss manufactured a "setup" out of thin air.
Kahneman and Tversky's prospect theory, first published in Econometrica in 1979, established that losses produce roughly twice the psychological impact of equivalent gains. This asymmetry doesn't just make losses feel worse. It generates urgency to erase them immediately, which creates the illusion that opportunities exist where they don't. The next "setup" isn't found through analysis. It's conjured by the need for emotional relief.
The data at the moment of a revenge trade is almost always sparse. That's its signature. A trader operating within their process might see three, four, five independent signals aligning before they commit capital. A revenge trade typically shows one or zero. The absence of confirming data isn't something you notice in the moment because you aren't looking at data. You're responding to your P&L. And the difference between "I see a setup" and "I need a setup to exist" is invisible from the inside without something external that forces the honest question.
The Thesis Broke Three Signals Before the Chart Confirmed It
Holding a losing position past the invalidation point happens because the brain reframes deteriorating evidence as temporary noise rather than structural change. The data usually signals the thesis is broken well before price reaches the level where most traders finally admit it, and the lag between data invalidation and psychological acceptance is where the largest unnecessary losses accumulate.
Your long BTC position at $68,200 was based on a demand zone and bullish structure on the 15-minute chart. Price slid to $67,500, then $67,100. You held because "it'll come back to the entry." The phrase itself is telling. It references your entry price, a number that matters to your account but means nothing to the market.
What the data showed at $67,500, well before the position reached its worst point: CVD had turned negative and was accelerating, meaning aggressive sellers were dominating the tape and gaining intensity with each candle. A Change of Character signal had appeared on the 15-minute chart, marking the first structural break against the prevailing uptrend. Downside velocity had expanded to the 82nd session percentile, showing the selling was picking up speed rather than fading toward exhaustion.
Shefrin and Statman identified what they called the disposition effect in their 1985 paper in The Journal of Finance: traders hold losing positions an average of 124 days while selling winners after just 104 days. The asymmetry isn't analytical. It's psychological. Converting a paper loss into a realised one feels like admitting personal failure, so the brain builds narratives about recovery, temporary pullbacks, and "shaking out weak hands" to justify remaining in a position the data has already abandoned.
The structural evidence at $67,500 wasn't ambiguous. Three independent signals had broken the thesis. The CHoCH alone would have been a warning. Combined with accelerating negative CVD and expanding downside velocity, it was a structural invalidation visible across multiple dimensions simultaneously. The chart wouldn't confirm the breakdown clearly for another forty minutes. The synthesis showed it at $67,500.
Exiting a Position the Data Was Still Defending
The fear of giving back open profits creates exits that have no basis in market data. Traders who cut winners early aren't reacting to deterioration they've identified. They're reacting to the possibility of deterioration that hasn't appeared, and the preemptive exit sacrifices the highest-expectancy phase of the trade: the continuation where the original risk has been justified by the market.
Your RELIANCE long from ₹1,245 was up ₹30 when you closed it. The position continued another ₹48 after your exit. Direction was right. Timing of entry was right. But the exit gave back the majority of what the trade was offering.
At the moment you closed, the data showed: velocity remained stable and was still gently expanding, with no deceleration. Swing structure was intact, consecutive higher lows holding cleanly. No exhaustion signals had triggered across any dimension. RSI sat at the 58th session percentile, far from overextended by the day's standards. There was no data-supported reason to exit. The decision was driven entirely by the fear of watching open profit evaporate, a fear that Kahneman's loss aversion framework explains precisely. Unrealised gains that begin to shrink feel psychologically identical to direct losses from starting capital, and the brain treats them with the same urgency.
Terrance Odean's 1998 study at UC Davis, published in The Journal of Finance, analysed 10,000 retail trading accounts and found that the stocks traders sold went on to outperform the stocks they continued holding by an average of 3.4% over the following year. Traders systematically cut their strongest positions and held their weakest ones. The pattern held across experience levels, account sizes, and market conditions. Not because these traders lacked knowledge, but because the emotional architecture of profit-taking overrode whatever analytical framework they had.
The cruel irony is that cutting a winner early feels like discipline. It sounds responsible: "I locked in profit." But when every signal the market is producing says the position has room to run, the exit isn't discipline. It's fear wearing the language of prudence.
Turning Emotion Into a Question the Data Can Answer
The practical fix for emotional trading isn't better self-awareness or more journaling. It's converting the emotional impulse into a testable question that objective data can answer in real time. "I'm missing this move" becomes "Is the move statistically extended?" and the answer, visible across velocity, swing duration, and momentum context, either validates the urgency or dissolves it before the click.
"I need to get my money back" becomes "Does a setup exist by my usual criteria right now?" The answer is either yes, with multiple confirming signals, or no. "It'll come back" becomes "Have the structural signals that supported my thesis held or broken?" A CHoCH signal and negative CVD answer that without ambiguity. "I should lock in profit" becomes "Is there a data-based reason to exit?" When velocity is stable and swing structure is intact, the answer is clear.
That conversion requires seeing multiple independent data dimensions at the point of decision. Not afterwards during the evening journal session, and not by checking six different apps sequentially under time pressure, but in the seconds between the emotional impulse and the action. Brett Steenbarger's research on self-coaching, outlined across 101 daily lessons in The Daily Trading Coach, emphasises that the intervention must happen at the moment of the behaviour, not in retrospect. A post-session journal entry about FOMO doesn't prevent tomorrow's FOMO entry. Real-time data showing the move is at the 94th percentile does.
Each of the four scenarios in this article follows the same pattern. The emotion was understandable. The decision it produced was unsupported by data. And the data was, in principle, available at the moment of decision. What was missing wasn't the information itself. It was the ability to see it all at once, synthesised across dimensions, at the exact moment the emotion was trying to make the call.
Draconic, an AI trading intelligence platform, changes this moment structurally. Instead of asking yourself whether you're being emotional, you ask Draconic what the data shows. "NIFTY just hit 22,440 after a 180-point rally. What am I missing?" The response synthesises velocity percentile, swing duration progression, CVD direction, structural positioning, and momentum context into one answer. The emotion doesn't disappear. But it has to compete with specific, quantified evidence rather than operating unopposed in a vacuum.
NSE's analysis of retail F&O participation patterns shows that the average retail options position is held for less than 30 minutes, and that the majority of unprofitable exits occur within the first 10 minutes of entry. The speed of these decisions makes post-session review almost irrelevant as a prevention mechanism. The intervention has to exist where the decision happens, in real time, with the data already synthesised. That's where the perception gap finally closes.
Trading psychology books are right about the diagnosis. FOMO, revenge, hope, and premature exits are real patterns with documented mechanisms. But diagnosis without real-time intervention leaves those patterns repeating session after session. What changes isn't the emotion. It's whether the emotion operates in a data vacuum or against specific, multi-dimensional evidence that forces an honest answer.
Every one of those four scenarios had an answer in the data. The question is whether you can see it before you click.
See what objective data shows at the moments that matter most.
More like this

July 4, 2026ai-trading
Chartink Alternative: Draconic vs Chartink
The Draconic Team • 6 min

July 4, 2026ai-trading
Sensibull Alternative: Draconic vs Sensibull
The Draconic Team • 6 min
May 12, 2026behind-the-price
Sector Rotation — The Macro Signal Most Traders Ignore
The Draconic Team • 3 min
May 11, 2026behind-the-price
How Market Makers Create Invisible Floors and Ceilings
The Draconic Team • 11 min