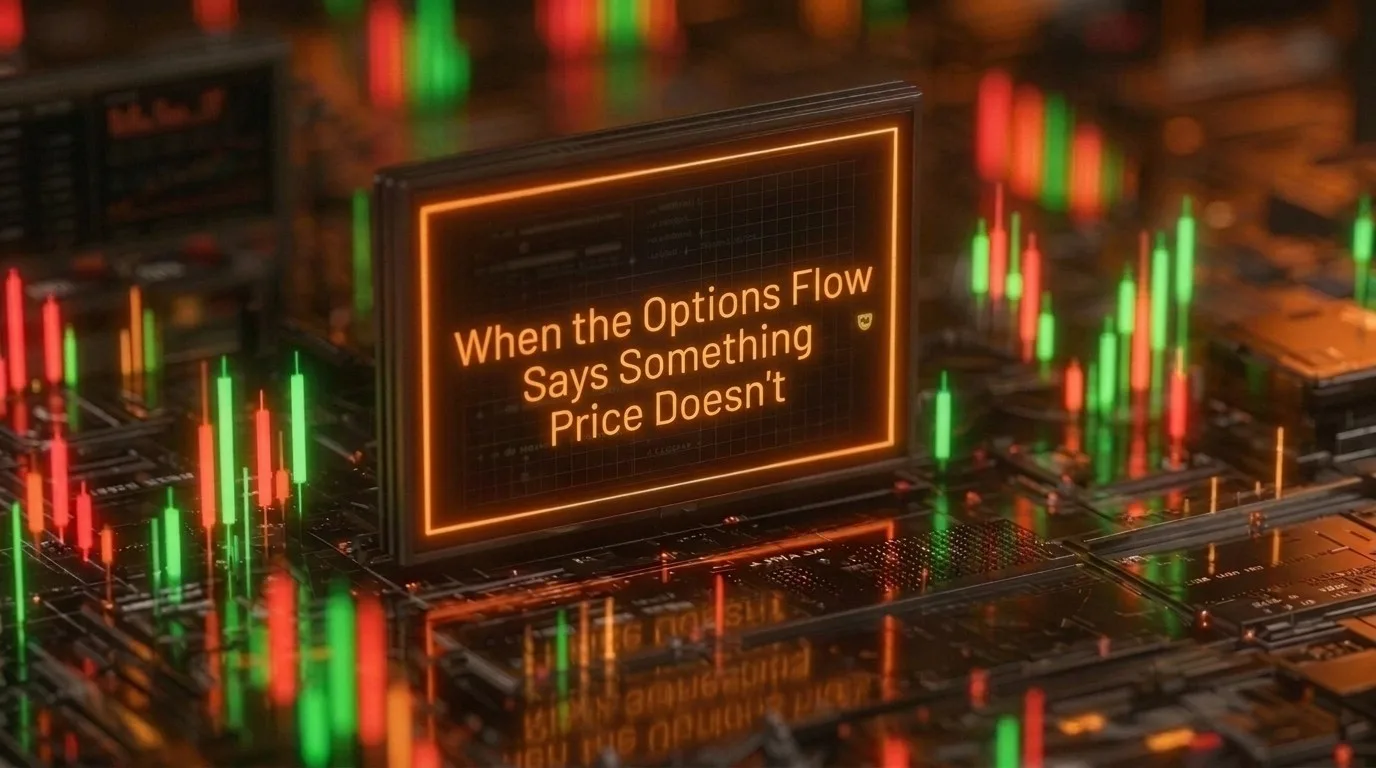
Options Flow Divergence Explained
The Problem
Price is making new highs. Your chart looks bullish. But the options flow is telling a different story: institutional put buying has been accelerating for two hours while price climbed. RSI agrees with the chart, MACD agrees, the trend is intact. You go long. Then it reverses sharply, takes your stop, and keeps falling. In hindsight, the option chain was screaming the warning you never heard.
This is the most expensive blind spot in single-dimensional trading. Price reflects what has already happened. Options flow reflects what institutions are positioning for next. When the two diverge, the resolution almost always favours flow, because flow represents committed capital from participants with better information infrastructure than any retail chart setup.
The problem isn't that flow data is unavailable. It's that reading flow in isolation is nearly as dangerous as ignoring it. Not every large trade is directional. Institutions hedge constantly. Without a framework for separating genuine positioning from routine activity, flow data is just a faster way to get confused.
KEY INSIGHT
Options flow reveals institutional positioning that price hasn't yet reflected. When flow diverges from price, institutions buying puts while price rises, or aggressive call sweeps while price consolidates, the divergence often resolves in flow's direction. The key is distinguishing genuine institutional positioning from noise.
What Changes With Synthesis
The traditional approach to reading options flow is manual pattern recognition. You open a flow scanner, watch thousands of trades scroll past, and try to spot meaningful activity by size, strike, or urgency. It's like drinking from a firehose. By the time you identify something interesting, you still need to check whether it's a hedge, whether price structure supports the signal, and whether momentum confirms or contradicts. That process takes minutes you don't have, and the mental load of holding flow context while switching to charts and indicators fragments your analysis.
The deeper issue is that flow viewed alone lacks the context required to interpret it. A block of 2,000 put contracts at a specific strike could be a directional bet, a hedge on an existing equity position, a leg of a spread, or someone closing a profitable trade. The flow data alone can't tell you which. You need price structure, momentum quality, and the gamma regime to distinguish signal from noise.
What changes with multi-dimensional synthesis is that flow is never interpreted in isolation. A single question, "What's the options flow saying about NIFTY right now, and does the rest of the picture confirm it?" produces an answer that places flow activity in the context of CVD direction, velocity character, structural levels, and gamma regime simultaneously. The interpretation happens across dimensions, not sequentially. That's where flow becomes actionable rather than ambiguous.
The Method
How to read options flow divergence
Step 1: Identify the flow signal (what stands out)
Start with what deviates from normal. Four patterns carry the most institutional signal. Sweep orders are aggressive, time-sensitive executions that hit multiple exchanges simultaneously because the buyer needs size filled now, not at the best price. Block trades are large single prints, typically negotiated off-exchange, that represent a single decision from a single desk. Repeat buying is the same strike being hit again and again over 30 to 90 minutes, suggesting systematic accumulation rather than a one-off trade. And the simplest filter: unusual volume relative to existing open interest at a strike, which indicates new positions being opened rather than old ones being managed.
Look for these at strikes near current price or at levels that correspond to known structural zones (put walls, call walls, gamma flip levels). Flow activity at random far-out-of-the-money strikes is usually noise. Flow activity clustering around mechanically significant strikes is usually signal.
Step 2: Assess signal quality (conviction or hedge?)
Not every large trade is a directional bet. Institutions hedge constantly, and hedging activity looks similar to directional positioning on a flow scanner. Three questions separate them.
First, is this opening or closing? Rising open interest at the strike means new positions. Flat or declining OI means someone is exiting or rolling. New positions carry more signal. Second, how was it executed? Sweeps indicate urgency, which correlates with conviction. Passive limit orders filled over hours suggest hedging or routine portfolio management. Third, what's the premium commitment? A sweep that spends ₹15 crore on put premium at a strike with low prior OI is a meaningful capital decision. The same notional spread across ten strikes in a complex spread is portfolio management.
The rule of thumb: sweeps with heavy premium at strikes with low prior open interest are likely new institutional positioning. Limit orders at strikes with heavy existing OI are likely adjustments.
Step 3: Check for price confirmation or divergence
Now compare what flow is saying to what price is doing. Two outcomes matter.
Confirmation means price is already moving in the direction flow suggests. Call sweeps while price breaks higher. Put accumulation while price breaks lower. This is valuable but expected. The flow is confirming what the chart already shows.
Divergence means flow is pointing the opposite direction from current price action. Institutional put buying while price makes new highs. Aggressive call sweeps while price sits in a downtrend. This is the high-value signal, because it means participants with size are positioning for something the chart doesn't reflect yet. Divergences carry more edge precisely because they're uncomfortable. Acting on a bearish flow signal while the chart looks bullish requires a framework, not gut instinct.
Step 4: Validate with additional dimensions before acting
Flow divergence alone is a watch signal, not a trade signal. Before acting, check at least one additional independent dimension.
Does CVD confirm the flow's direction? If put sweeps are accumulating while price rises, and CVD is simultaneously showing declining buyer aggression, you have two independent dimensions pointing the same way. That's actionable. Is momentum quality deteriorating? Velocity decelerating while flow diverges adds a third dimension. Is the gamma regime compatible with the move flow is suggesting? A bearish flow divergence in a negative gamma regime is more dangerous than the same divergence in positive gamma, where market maker hedging dampens the move.
The decision rule: flow divergence plus one independent confirmation from CVD, momentum, or positioning equals an actionable signal. Reduce size on existing positions or prepare for a reversal. Flow divergence alone equals watchlist only. Hold off, observe, and wait for confirmation before committing capital.
In Practice
Thursday morning, 10:15 AM. NIFTY is at 22,680, up 90 points from the open. The 15-minute chart shows three consecutive bullish candles with expanding bodies. RSI is at 62 and rising. Supertrend is bullish. On the surface, everything says continuation.
But the flow tells a different story.
Starting at 9:50, put sweeps began accumulating at the 22,600 strike. Three separate sweeps over 25 minutes, each between 800 and 1,200 contracts, all opening new positions (OI at that strike rose from 4.2 lakh to 5.8 lakh). Total premium committed: approximately ₹11 crore. These weren't passive hedges placed by a single desk. They were aggressive, time-sensitive executions from what appeared to be multiple participants converging on the same strike.
Step 1 identifies the signal: repeat put sweeps at a strike 80 points below current price, with heavy premium and rising OI.
Step 2 qualifies it: all three are sweeps (urgent), all are opening (new OI), and the premium commitment is significant relative to the strike's prior activity. This passes the conviction filter.
Step 3 compares to price: clear divergence. Price is making session highs while institutional put positioning builds below. The chart says bullish. The flow says someone with ₹11 crore disagrees.
Step 4 validates. CVD, which had been positive through the morning rally, started flattening at 10:05 and turned slightly negative by 10:20. Buyer aggression was fading even as price pushed higher, meaning the rally was losing its engine. Velocity on the current up-swing had decelerated from 1.8 to 0.9 points per minute over the last three candles: same direction, half the speed. And the gamma regime was negative below 22,700, which meant if price turned, market maker hedging would amplify rather than cushion the decline.
Three independent dimensions confirmed the flow divergence: fading CVD, decelerating velocity, and a gamma regime that would accelerate any downside move. By 10:45, NIFTY reversed from 22,710 and dropped 140 points over the next 90 minutes, settling near the 22,570 level, right through the 22,600 put strike where those sweeps had concentrated.
Now consider a different scenario the following Tuesday. NIFTY at 22,450, drifting lower. Put buying appears at 22,400, similar size to Thursday's activity. A single-dimension read would say "bearish flow, price declining, confirmation." But CVD is holding flat, not confirming seller aggression. Velocity on the decline is slow and steady, not accelerating. And OI data shows the put buyer also holds a large long futures position. This is protective hedging: a long holder buying downside insurance, not a directional bet on further decline. The additional dimensions reveal what the flow scanner alone cannot.
Common Mistakes
- Treating every large trade as directional. Institutions hedge constantly. A ₹20 crore put purchase can be downside protection on an existing ₹200 crore equity position, not a bet that the market will fall. Without checking whether the activity is opening or closing, whether it's part of a spread, and whether other dimensions confirm, you're reading signal where there may be none.
- Acting on flow without dimensional confirmation. Flow divergence on its own is an observation, not a trade signal. Traders who see a large put sweep and immediately short are treating flow as a crystal ball. The edge comes from flow plus at least one confirming dimension: CVD, velocity, or positioning context. Flow alone produces as many false signals as real ones, particularly around events and expiry when hedging activity spikes.
- Ignoring time context. Flow signals compress and distort near weekly expiry and around scheduled events (RBI announcements, earnings, budget day). The volume of hedging activity increases dramatically, creating more noise relative to signal. A sweep that would be highly unusual on a quiet Monday is routine on Thursday morning. Adjust your threshold based on the calendar.
FAQs
Check three things: is OI increasing at that strike (new position, not closing), was it executed as a sweep (urgency suggests conviction), and does the premium size warrant attention relative to the strike's prior activity? Hedges tend to be passive, spread across strikes, and close existing exposure. Directional bets tend to be concentrated, aggressive, and open new positions.
Variable. Sweep orders before a news catalyst can precede the move by minutes. Institutional accumulation across days can take a week to reflect in price. Flow is not prediction. It's a positioning map that shows where capital is being committed, and the timeline between positioning and price resolution depends on the catalyst.
Indices, generally. NIFTY and BankNifty options have deep institutional participation, meaning flow activity is more likely to represent informed positioning. Individual stock options have lower liquidity and higher noise, where a single retail trader can create unusual volume that mimics institutional activity.
That's confirmation, not divergence. Useful but less interesting. Call sweeps during a rally or put buying during a decline confirm what's already visible. The edge comes from divergence, where flow reveals something the chart hasn't priced in yet. Confirmation is still worth noting because it increases conviction on an existing thesis.
Relevant
See flow divergence analysis in real-time
This guide is for informational and educational purposes only. It does not constitute financial advice. Trading involves risk. Draconic provides market intelligence; all trading decisions are your own.