How to Read Conflicting Signals Without Freezing
The Problem
Conflicting trading signals are the norm, not the exception. The 15-minute chart on NIFTY shows a clean uptrend with higher highs, higher lows, and price above VWAP. Your momentum indicators confirm: RSI rising, MACD histogram expanding. Everything says long.
Then you check the options chain. Put sweeps are accelerating at the nearest strike. CVD has been declining for the past 40 minutes even as price made new highs. The gamma regime just flipped negative.
Two data sources. Two opposite stories. Your finger hovers over the buy button, and the hesitation costs you either a missed trade or a bad entry. This is the moment most traders handle badly, not because they lack information, but because they have no framework for deciding which information matters more right now.
KEY INSIGHT
Conflicting signals between independent dimensions are not noise to be resolved by picking a side. They carry information. A signal hierarchy, where the dominant dimension shifts based on market context (trending, near structure, or at potential reversal), converts paralysis into a structured decision: act, wait, or reduce size.
What Changes With Synthesis
The traditional response to conflicting signals is one of two extremes. Some traders default to the dimension they trust most, usually price, and ignore everything else. Others freeze, waiting for all dimensions to agree before acting. Both approaches lose money consistently, just in different ways.
The first approach loses because price is one chapter of a multi-chapter story. The trader who went long on a clean uptrend while ignoring accelerating put sweeps and negative CVD divergence was reading the chart accurately and still getting the trade wrong. The second approach loses because perfect agreement across all dimensions is rare. Waiting for five dimensions to align means missing the vast majority of legitimate setups, because markets almost always contain some degree of internal disagreement.
What changes with multi-dimensional synthesis is not the elimination of conflict, but the ability to read it structurally. When all dimensions are visible simultaneously, the question shifts from "which signal do I follow?" to "given the current market context, which dimension has earned priority?" That question has a repeatable answer.
The Method
The conflicting signals decision framework
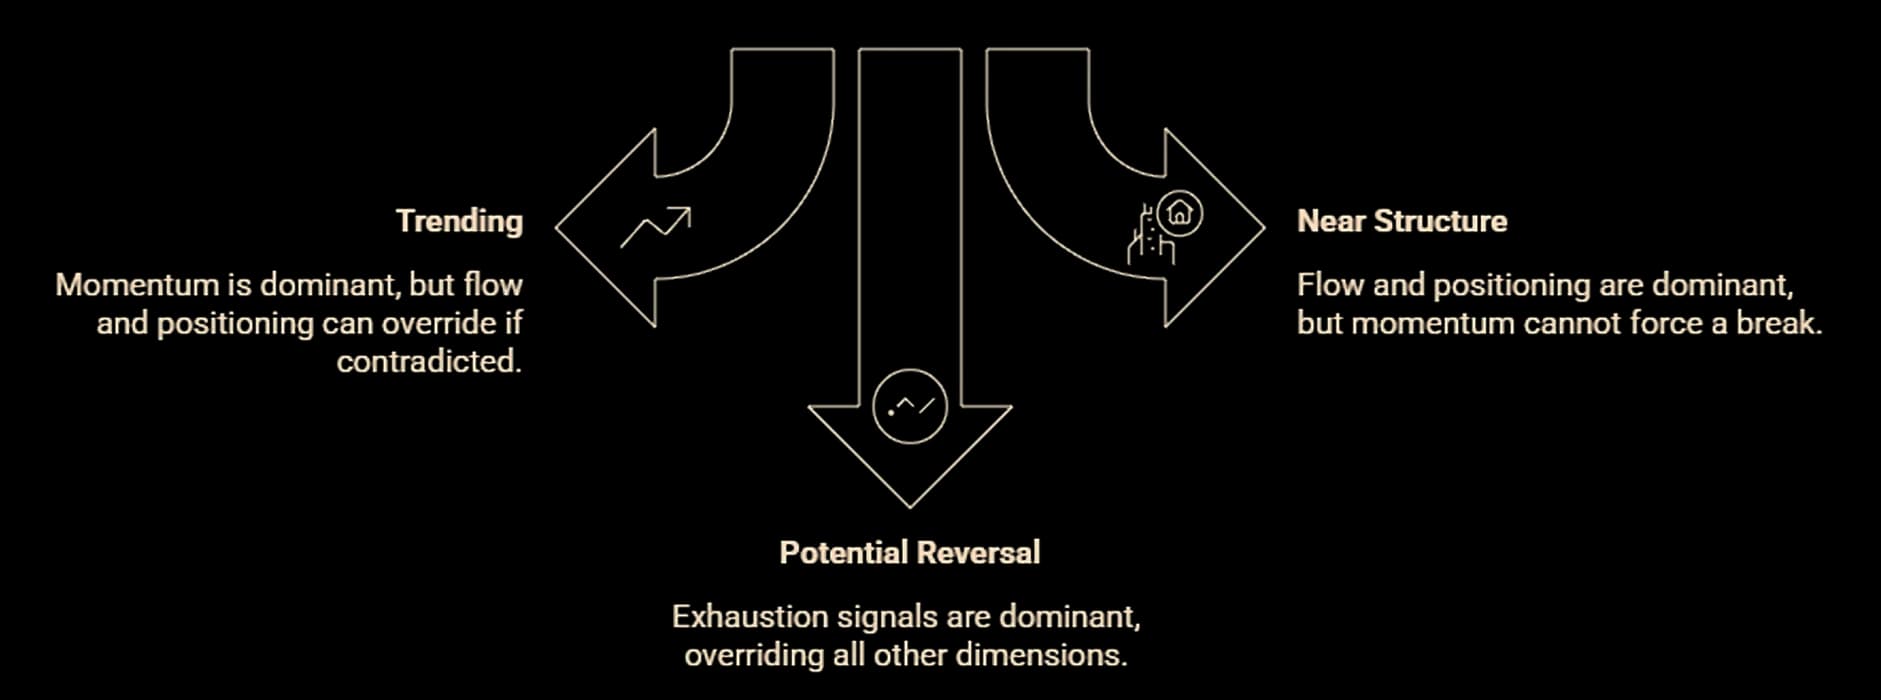
The signal hierarchy framework assigns priority to different dimensions based on what the market is doing right now. The dominant dimension is not fixed. It rotates depending on whether price is trending, approaching a structural level, or showing signs of exhaustion.
Step 1: Classify the current market context (30 seconds)
Before resolving any conflict, identify which of three regimes the market is operating in. Check the higher timeframe trend direction and the most recent structural pattern. A market making consecutive higher highs on the 15-minute with expanding velocity is trending. A market approaching a prior swing high with volume profile resistance and a put wall overhead is near key structure. A market where velocity is decelerating across successive swings while statistical extremes are clustering is at a potential reversal. The regime determines which signals carry the most weight in steps 2 through 4.
Step 2: Apply the hierarchy for trending markets
In a confirmed trend, momentum signals take priority. Velocity expanding, swing acceleration positive, and multi-timeframe alignment all outweigh contradictions from other dimensions. If price is trending with genuine momentum quality and options flow shows some institutional hedging in the opposite direction, the hedging is more likely protective than directional. Institutions frequently buy puts while remaining long, because their risk management requires it.
The override condition: if CVD divergence develops alongside the contradictory flow, momentum is no longer trustworthy by itself. Two independent dimensions contradicting the trend (flow and volume delta) outweigh one dimension confirming it (price direction). Tighten stops or reduce size, but do not reverse on the divergence alone.
Step 3: Apply the hierarchy near key structural levels
When price approaches a significant level, whether that is a high-volume node, an order block, a gamma flip level, or an options wall, flow and positioning signals take priority over momentum. This is where the "perfect breakout" traps traders most often. Momentum looks strong, price pushes through the level, and then it reverses. The reason: the positioning context (gamma regime, OI concentration, institutional flow) determined whether the level would hold or break, and momentum alone could not override those mechanical forces.
Near structure, check: is the gamma regime compatible with a sustained break? Is flow confirming the direction, or is aggressive positioning building on the other side? Does volume profile show a low-volume node beyond the level (easy continuation) or a high-volume node (likely friction)? If positioning and flow contradict the momentum, the level is more likely to hold. Act accordingly: tighter stops if entering, or wait for a post-breakout retest to confirm the break was genuine.
Step 4: Apply the hierarchy at potential reversals
When exhaustion signals are firing, whether that is velocity deceleration across successive swings, swing duration expanding beyond the session average, or multiple metrics simultaneously reaching statistical extremes, exhaustion signals take priority over everything else. A market can show bullish momentum, bullish flow, and supportive options positioning, and still reverse if the move has reached the point of statistical unsustainability.
This is the hardest hierarchy to follow because every other dimension may still look healthy. The move feels strong. The chart looks clean. But the exhaustion framework is measuring something the other dimensions are not: whether the rate and duration of the move have exceeded what the current session can sustain. When two of three exhaustion dimensions fire (velocity deceleration plus swing duration expansion, or velocity deceleration plus combined statistical extremes), treat the reversal probability as elevated regardless of what other dimensions say.
Step 5: Recognize when conflict is the signal
Sometimes the most important information is that the dimensions disagree. A market where price trends up, flow is aggressively bearish, momentum is decelerating, and options positioning is neutral is not giving you a trade in either direction. It is telling you that uncertainty is elevated and the next large move could go either way.
The appropriate response to genuine multi-dimensional conflict is not to pick a side. It is to reduce size or stand aside. A confluence score of 2/5 with one dimension actively contradicting is a no-trade condition, not a coin flip. The conflict resolves eventually, and the resolution often produces a clean signal. Waiting for that resolution protects capital. Forcing a decision when the data is genuinely split is gambling, not trading.
In Practice
NIFTY is trading at 23,340 on a Thursday afternoon. Here is what each dimension shows.
Price structure: The 15-minute chart has made three consecutive higher lows over the past two hours. Price is above VWAP. The most recent swing high was 23,365, and price is pulling back from it. Structurally, this looks like a bullish continuation setup on a pullback to the prior breakout level near 23,330.
Momentum: Velocity on the current swing is at the 62nd session percentile, moderate but not strong. More importantly, the previous two swings registered at the 78th and 71st percentile respectively. Velocity is decelerating across successive swings.
Flow: CVD has been flat for 45 minutes while price made those three higher lows. Aggressive buying is not driving this move. On the options side, put volume at the 23,300 strike has increased meaningfully in the past hour, but the trades are limit orders, not sweeps.
Options positioning: Gamma is positive. The put wall sits at 23,200, and the call wall at 23,400. Max pain for the weekly expiry is at 23,300. Price is trading in the upper half of the expected range, 60 points from the call wall.
Timeframe alignment: The 5-minute trend is bullish. The 15-minute is bullish. The hourly shows price near the top of a two-day range that has not broken convincingly.
Classifying the context: Price is near key structure (the 23,365 swing high and the 23,400 call wall overhead). This is not a clean trending environment. It is an approach to resistance.
Applying the hierarchy: Near structure, flow and positioning take priority. Flow is not confirming: CVD is flat, and the put activity at 23,300, while passive rather than aggressive, suggests some institutional interest in downside protection. Positioning shows positive gamma with a call wall 60 points above. In positive gamma, market makers sell rallies near the call wall, creating mechanical resistance. The gamma regime is incompatible with a sustained break above 23,400.
Reading the conflict: Momentum is decelerating. Flow is not confirming. Positioning creates a mechanical ceiling nearby. The bullish price structure is real, but three independent dimensions are either contradicting it or failing to confirm it. This is a 2/5 confluence score with one active contradiction (positioning).
The decision: Do not enter long at 23,340 targeting a break of 23,365. The probability of a sustained move through the call wall in positive gamma, with decelerating velocity and flat CVD, is low. If already long from lower levels, this is a partial profit zone, not an add zone. Wait for either a pullback to the 23,280 to 23,300 area where the put wall and max pain provide structural support, or for a genuine break above 23,400 confirmed by a gamma regime shift.
Common Mistakes
- Defaulting to your favourite dimension. Traders who learned on charts default to price. Traders who discovered options flow default to flow. The hierarchy is not about personal preference. It is about which dimension has the strongest mechanical relationship to the current market context. A flow trader who ignores a clean structural break because "the flow doesn't confirm" misses genuine breakouts. A chart trader who ignores negative gamma at a resistance level takes the same loss repeatedly.
- Treating all conflicts as equal. A minor disagreement, where one dimension is neutral rather than confirming, is different from a hard contradiction, where one dimension is actively pointing the opposite direction. Neutral means "not enough evidence." Contradicting means "evidence against." The first calls for reduced conviction. The second calls for standing aside.
- Waiting for zero conflict. Five dimensions in perfect agreement is rare, and when it does happen, the move is often already underway. The framework is designed to help you act on 3/5 agreement with manageable contradictions, not to wait for 5/5 unanimity that almost never arrives.
FAQs
Neutral dimensions do not confirm your trade. Two contradictions against three neutrals is a stand-aside condition. You need at least three dimensions actively confirming, with no hard contradictions, to justify a standard-size entry.
Yes. On expiry day, options positioning and gamma mechanics become the dominant dimension regardless of what price structure or momentum show. Theta collapse, max pain gravity, and amplified gamma override normal hierarchy rules from roughly 1:00 PM onward on Thursday NIFTY expiry.
Check the higher timeframe. If the 15-minute or hourly shows clean directional structure with expanding velocity, you are in trending mode. If price is within two ATR of a major level (prior swing, options wall, volume profile node), you are near structure. If velocity is decelerating and swing duration is expanding, you are at potential reversal. When in doubt, default to "near structure," because that hierarchy is the most conservative.
The price, momentum, and flow dimensions apply across all markets. The options positioning dimension applies only where liquid options markets exist (primarily Indian and US equity indices). For crypto and forex, use a four-dimension version: structure, momentum, flow (CVD and order book), and timeframe alignment.
That is the intended outcome. When dimensions converge after a period of disagreement, the resulting signal is typically cleaner and more reliable than signals generated during the conflict. Patience during genuine multi-dimensional disagreement is not missed opportunity. It is capital preservation.
Relevant
See how synthesis resolves conflicting signals
This guide is for informational and educational purposes only. It does not constitute financial advice. Trading involves risk. Draconic provides market intelligence; all trading decisions are your own.